29
/
en
AIzaSyAYiBZKx7MnpbEhh9jyipgxe19OcubqV5w
April 1, 2024
115836
Cuba
CUB
true
2
1
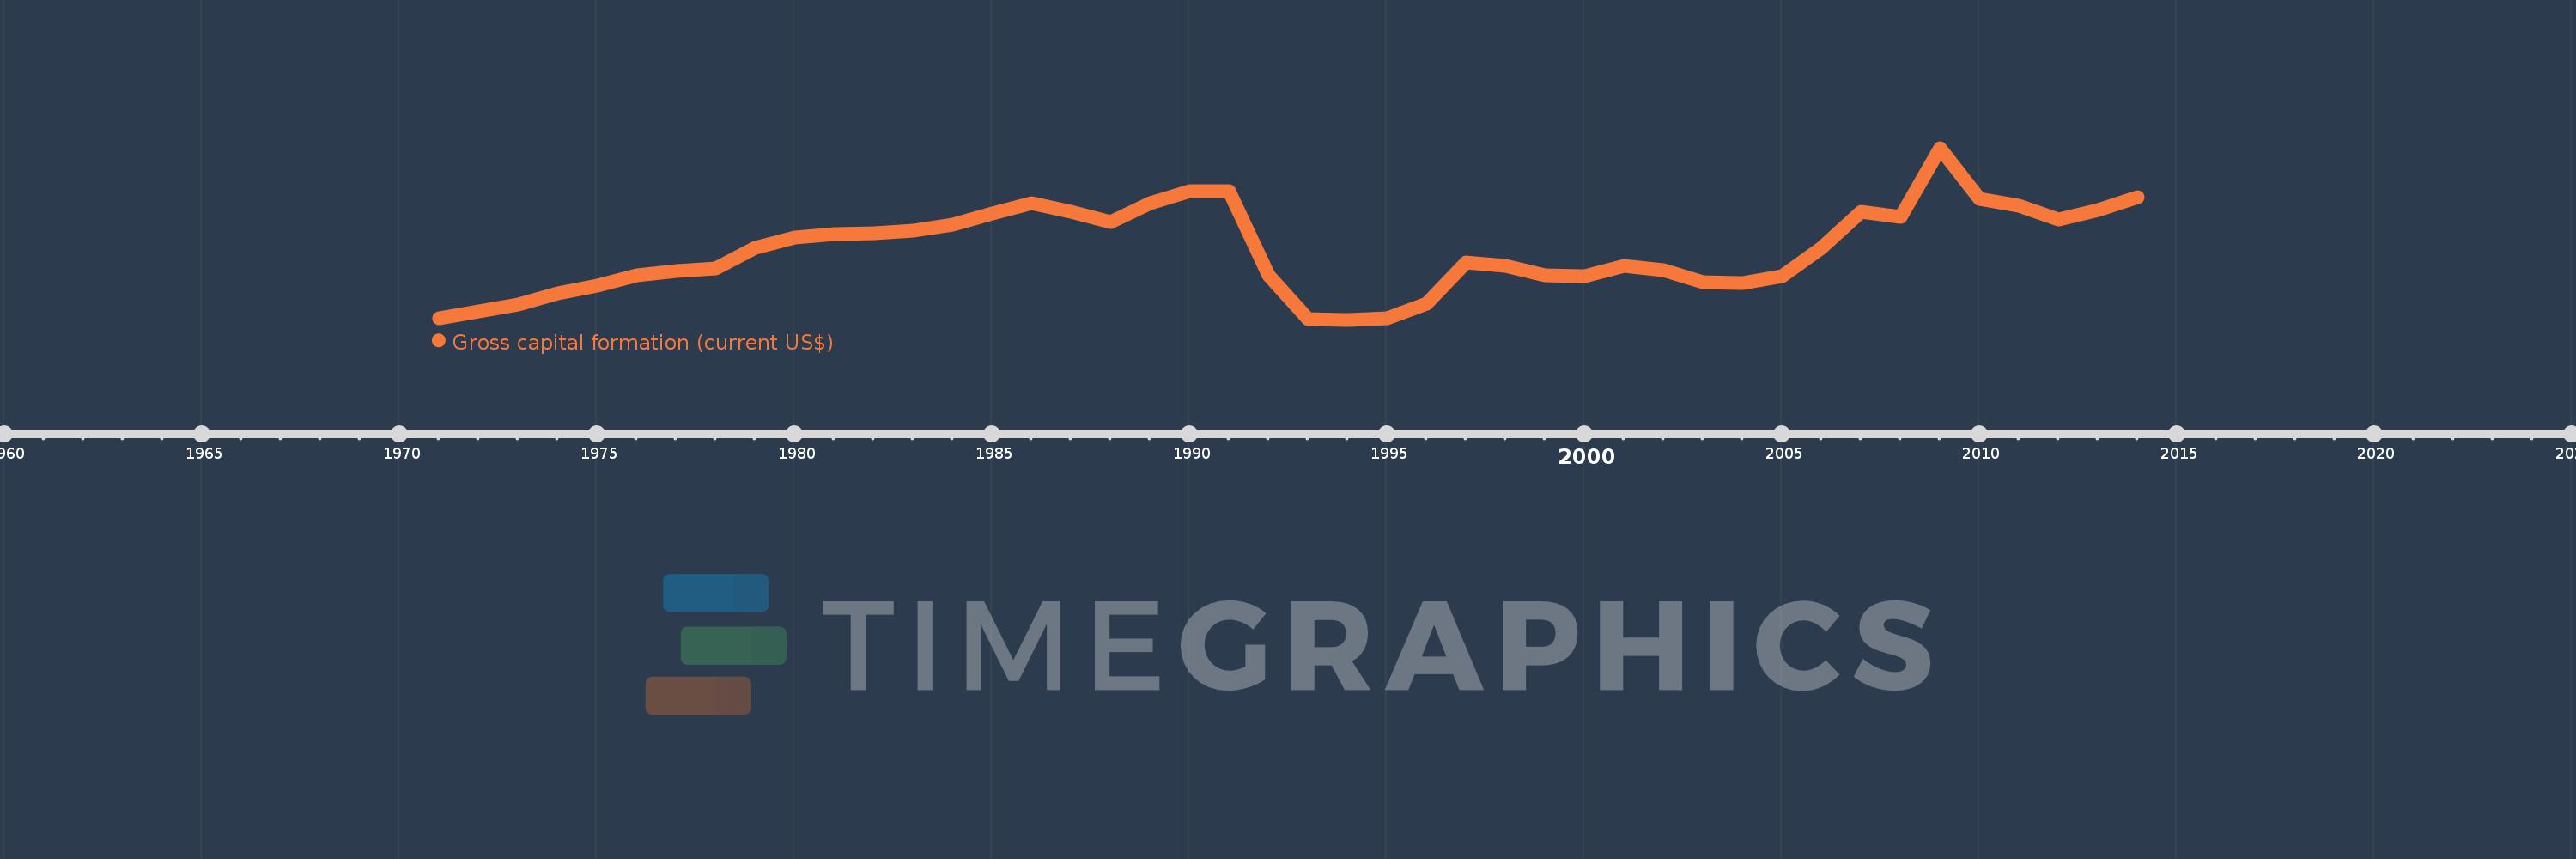
Gross capital formation (current US$)
2014,2013,2012,2011,2010,2009,2008,2007,2006,2005,2004,2003,2002,2001,2000,1999,1998,1997,1996,1995,1994,1993,1992,1991,1990,1989,1988,1987,1986,1985,1984,1983,1982,1981,1980,1979,1978,1977,1976,1975,1974,1973,1972,1971
This statistics in other country:
AfghanistanAlbaniaAlgeriaAngolaAntigua and BarbudaArab WorldArgentinaArmeniaArubaAustraliaAustriaAzerbaijanBahamas, TheBahrainBangladeshBarbadosBelarusBelgiumBelizeBeninBermudaBhutanBoliviaBosnia and HerzegovinaBotswanaBrazilBrunei DarussalamBulgariaBurkina FasoBurundiCabo VerdeCambodiaCameroonCanadaCaribbean small statesCentral African RepublicCentral Europe and the BalticsChadChileChinaColombiaComorosCongo, Dem. Rep.Congo, Rep.Costa RicaCote d'IvoireCroatiaCubaCyprusCzech RepublicDenmarkDjiboutiDominicaDominican RepublicEarly-demographic dividendEast Asia & PacificEast Asia & Pacific (excluding high income)East Asia & Pacific (IDA & IBRD countries)EcuadorEgypt, Arab Rep.El SalvadorEquatorial GuineaEritreaEstoniaEthiopiaEuro areaEurope & Central AsiaEurope & Central Asia (excluding high income)Europe & Central Asia (IDA & IBRD countries)European UnionFaroe IslandsFijiFinlandFragile and conflict affected situationsFranceGabonGambia, TheGeorgiaGermanyGhanaGreeceGrenadaGuatemalaGuineaGuinea-BissauGuyanaHaitiHeavily indebted poor countries (HIPC)High incomeHondurasHong Kong SAR, ChinaHungaryIBRD onlyIcelandIDA & IBRD totalIDA blendIDA onlyIDA totalIndiaIndonesiaIran, Islamic Rep.IraqIrelandIsraelItalyJamaicaJapanJordanKazakhstanKenyaKiribatiKorea, Rep.KosovoKuwaitKyrgyz RepublicLao PDRLate-demographic dividendLatin America & Caribbean Latin America & Caribbean (excluding high income)Latin America & the Caribbean (IDA & IBRD countries)LatviaLeast developed countries: UN classificationLebanonLesothoLiberiaLibyaLithuaniaLow & middle incomeLow incomeLower middle incomeLuxembourgMacao SAR, ChinaMacedonia, FYRMadagascarMalawiMalaysiaMaldivesMaliMaltaMauritaniaMauritiusMexicoMicronesia, Fed. Sts.Middle East & North AfricaMiddle East & North Africa (excluding high income)Middle East & North Africa (IDA & IBRD countries)Middle incomeMoldovaMongoliaMontenegroMoroccoMozambiqueNamibiaNepalNetherlandsNew CaledoniaNew ZealandNicaraguaNigerNigeriaNorth AmericaNorwayOECD membersOmanOther small statesPakistanPanamaPapua New GuineaParaguayPeruPhilippinesPolandPortugalPost-demographic dividendPre-demographic dividendPuerto RicoQatarRomaniaRussian FederationRwandaSaudi ArabiaSenegalSerbiaSeychellesSierra LeoneSingaporeSlovak RepublicSloveniaSmall statesSolomon IslandsSouth AfricaSouth AsiaSouth Asia (IDA & IBRD)South SudanSpainSri LankaSt. Kitts and NevisSt. LuciaSt. Vincent and the GrenadinesSub-Saharan Africa Sub-Saharan Africa (excluding high income)Sub-Saharan Africa (IDA & IBRD countries)SudanSurinameSwazilandSwedenSwitzerlandSyrian Arab RepublicTajikistanTanzaniaThailandTimor-LesteTogoTongaTrinidad and TobagoTunisiaTurkeyTurkmenistanUgandaUkraineUnited Arab EmiratesUnited KingdomUnited StatesUpper middle incomeUruguayUzbekistanVanuatuVenezuela, RBVietnamWest Bank and GazaWorldYemen, Rep.ZambiaZimbabwe Timeline:
This timeline shows a graph from 1971 to 2014 of Cuba. No data until 1970. Number of actual observations by date: 44.
Source name:
World Development Indicators
Source organization:
World Bank national accounts data, and OECD National Accounts data files.
Categories, topics:
Economy & Growth
Last updated:
apr 23, 2017
Indicators value changes by year
Minimum:
1.43 bln
jan 1, 1994
Maximum:
9.027 bln
jan 1, 2009
At the date of observation
Value
Absolute change
Change from previous value
jan 1, 1971
1.476 bln
+1.476 bln
0.0%
jan 1, 1972
1.793 bln
+317.431 mln
21.51%
jan 1, 1973
2.11 bln
+316.361 mln
17.64%
jan 1, 1974
2.588 bln
+478.625 mln
22.69%
jan 1, 1975
2.953 bln
+364.792 mln
14.09%
jan 1, 1976
3.381 bln
+428.026 mln
14.49%
jan 1, 1977
3.584 bln
+202.259 mln
5.98%
jan 1, 1978
3.683 bln
+99.062 mln
2.76%
jan 1, 1979
4.608 bln
+925.768 mln
25.14%
jan 1, 1980
5.047 bln
+438.729 mln
9.52%
jan 1, 1981
5.231 bln
+183.954 mln
3.64%
jan 1, 1982
5.269 bln
+37.884 mln
0.72%
jan 1, 1983
5.364 bln
+94.93 mln
1.8%
jan 1, 1984
5.626 bln
+262.269 mln
4.89%
jan 1, 1985
6.13 bln
+504.264 mln
8.96%
jan 1, 1986
6.593 bln
+462.578 mln
7.55%
jan 1, 1987
6.188 bln
-405.337 mln
-6.15%
jan 1, 1988
5.762 bln
-425.785 mln
-6.88%
jan 1, 1989
6.597 bln
+834.929 mln
14.49%
jan 1, 1990
7.115 bln
+518.084 mln
7.85%
jan 1, 1991
7.105 bln
-10.064 mln
-0.14%
jan 1, 1992
3.403 bln
-3.701 bln
-52.1%
jan 1, 1993
1.446 bln
-1.958 bln
-57.53%
jan 1, 1994
1.43 bln
-15.263 mln
-1.06%
jan 1, 1995
1.491 bln
+61.051 mln
4.27%
jan 1, 1996
2.134 bln
+643.05 mln
43.12%
jan 1, 1997
3.977 bln
+1.843 bln
86.33%
jan 1, 1998
3.793 bln
-184.0 mln
-4.63%
jan 1, 1999
3.398 bln
-395.0 mln
-10.41%
jan 1, 2000
3.363 bln
-35.0 mln
-1.03%
jan 1, 2001
3.822 bln
+459.2 mln
13.65%
jan 1, 2002
3.632 bln
-189.9 mln
-4.97%
jan 1, 2003
3.089 bln
-543.2 mln
-14.95%
jan 1, 2004
3.053 bln
-36.2 mln
-1.17%
jan 1, 2005
3.362 bln
+309.6 mln
10.14%
jan 1, 2006
4.595 bln
+1.232 bln
36.64%
jan 1, 2007
6.186 bln
+1.591 bln
34.64%
jan 1, 2008
5.968 bln
-218.0 mln
-3.52%
jan 1, 2009
9.027 bln
+3.058 bln
51.25%
jan 1, 2010
6.788 bln
-2.238 bln
-24.8%
jan 1, 2011
6.482 bln
-306.5 mln
-4.52%
jan 1, 2012
5.845 bln
-636.9 mln
-9.83%
jan 1, 2013
6.271 bln
+426.6 mln
7.3%
jan 1, 2014
6.846 bln
+574.8 mln
9.17%
Ranking of countries by current statistics by years


Comments: