29
/
en
AIzaSyAYiBZKx7MnpbEhh9jyipgxe19OcubqV5w
April 1, 2024
213005
Nigeria
NGA
true
2
1
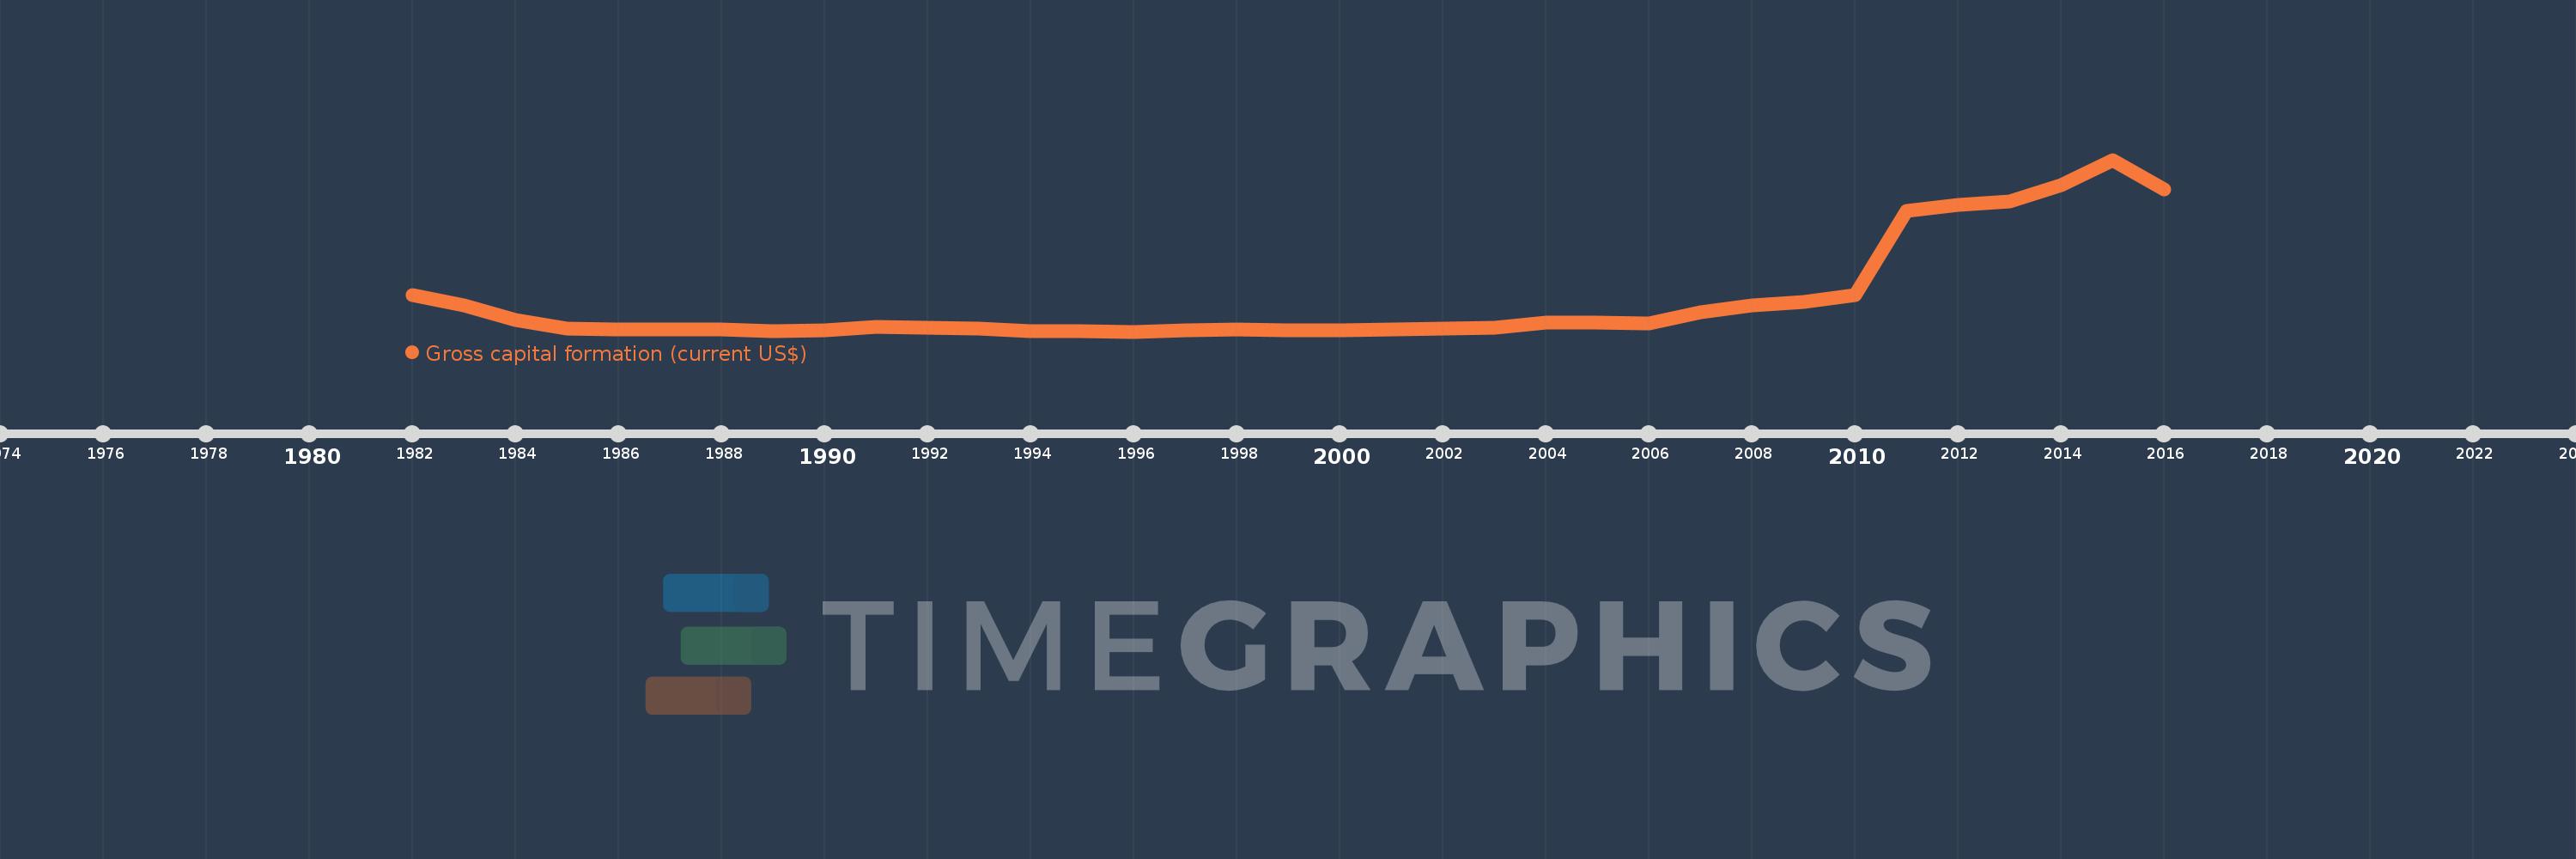
Gross capital formation (current US$)
2016,2015,2014,2013,2012,2011,2010,2009,2008,2007,2006,2005,2004,2003,2002,2001,2000,1999,1998,1997,1996,1995,1994,1993,1992,1991,1990,1989,1988,1987,1986,1985,1984,1983,1982
This statistics in other country:
AfghanistanAlbaniaAlgeriaAngolaAntigua and BarbudaArab WorldArgentinaArmeniaArubaAustraliaAustriaAzerbaijanBahamas, TheBahrainBangladeshBarbadosBelarusBelgiumBelizeBeninBermudaBhutanBoliviaBosnia and HerzegovinaBotswanaBrazilBrunei DarussalamBulgariaBurkina FasoBurundiCabo VerdeCambodiaCameroonCanadaCaribbean small statesCentral African RepublicCentral Europe and the BalticsChadChileChinaColombiaComorosCongo, Dem. Rep.Congo, Rep.Costa RicaCote d'IvoireCroatiaCubaCyprusCzech RepublicDenmarkDjiboutiDominicaDominican RepublicEarly-demographic dividendEast Asia & PacificEast Asia & Pacific (excluding high income)East Asia & Pacific (IDA & IBRD countries)EcuadorEgypt, Arab Rep.El SalvadorEquatorial GuineaEritreaEstoniaEthiopiaEuro areaEurope & Central AsiaEurope & Central Asia (excluding high income)Europe & Central Asia (IDA & IBRD countries)European UnionFaroe IslandsFijiFinlandFragile and conflict affected situationsFranceGabonGambia, TheGeorgiaGermanyGhanaGreeceGrenadaGuatemalaGuineaGuinea-BissauGuyanaHaitiHeavily indebted poor countries (HIPC)High incomeHondurasHong Kong SAR, ChinaHungaryIBRD onlyIcelandIDA & IBRD totalIDA blendIDA onlyIDA totalIndiaIndonesiaIran, Islamic Rep.IraqIrelandIsraelItalyJamaicaJapanJordanKazakhstanKenyaKiribatiKorea, Rep.KosovoKuwaitKyrgyz RepublicLao PDRLate-demographic dividendLatin America & Caribbean Latin America & Caribbean (excluding high income)Latin America & the Caribbean (IDA & IBRD countries)LatviaLeast developed countries: UN classificationLebanonLesothoLiberiaLibyaLithuaniaLow & middle incomeLow incomeLower middle incomeLuxembourgMacao SAR, ChinaMacedonia, FYRMadagascarMalawiMalaysiaMaldivesMaliMaltaMauritaniaMauritiusMexicoMicronesia, Fed. Sts.Middle East & North AfricaMiddle East & North Africa (excluding high income)Middle East & North Africa (IDA & IBRD countries)Middle incomeMoldovaMongoliaMontenegroMoroccoMozambiqueNamibiaNepalNetherlandsNew CaledoniaNew ZealandNicaraguaNigerNigeriaNorth AmericaNorwayOECD membersOmanOther small statesPakistanPanamaPapua New GuineaParaguayPeruPhilippinesPolandPortugalPost-demographic dividendPre-demographic dividendPuerto RicoQatarRomaniaRussian FederationRwandaSaudi ArabiaSenegalSerbiaSeychellesSierra LeoneSingaporeSlovak RepublicSloveniaSmall statesSolomon IslandsSouth AfricaSouth AsiaSouth Asia (IDA & IBRD)South SudanSpainSri LankaSt. Kitts and NevisSt. LuciaSt. Vincent and the GrenadinesSub-Saharan Africa Sub-Saharan Africa (excluding high income)Sub-Saharan Africa (IDA & IBRD countries)SudanSurinameSwazilandSwedenSwitzerlandSyrian Arab RepublicTajikistanTanzaniaThailandTimor-LesteTogoTongaTrinidad and TobagoTunisiaTurkeyTurkmenistanUgandaUkraineUnited Arab EmiratesUnited KingdomUnited StatesUpper middle incomeUruguayUzbekistanVanuatuVenezuela, RBVietnamWest Bank and GazaWorldYemen, Rep.ZambiaZimbabwe Timeline:
This timeline shows a graph from 1982 to 2016 of Nigeria. No data until 1981. Number of actual observations by date: 35.
Source name:
World Development Indicators
Source organization:
World Bank national accounts data, and OECD National Accounts data files.
Categories, topics:
Economy & Growth
Last updated:
apr 23, 2017
Indicators value changes by year
Minimum:
2.022 bln
jan 1, 1996
Maximum:
89.838 bln
jan 1, 2015
At the date of observation
Value
Absolute change
Change from previous value
jan 1, 1982
20.779 bln
+20.779 bln
0.0%
jan 1, 1983
15.285 bln
-5.493 bln
-26.44%
jan 1, 1984
7.755 bln
-7.53 bln
-49.27%
jan 1, 1985
3.54 bln
-4.215 bln
-54.35%
jan 1, 1986
3.279 bln
-260.651 mln
-7.36%
jan 1, 1987
3.254 bln
-25.548 mln
-0.78%
jan 1, 1988
3.051 bln
-202.645 mln
-6.23%
jan 1, 1989
2.292 bln
-759.231 mln
-24.88%
jan 1, 1990
2.846 bln
+554.447 mln
24.19%
jan 1, 1991
4.438 bln
+1.591 bln
55.9%
jan 1, 1992
3.778 bln
-659.122 mln
-14.85%
jan 1, 1993
3.751 bln
-27.268 mln
-0.72%
jan 1, 1994
2.149 bln
-1.602 bln
-42.7%
jan 1, 1995
2.025 bln
-124.33 mln
-5.78%
jan 1, 1996
2.022 bln
-2.972 mln
-0.15%
jan 1, 1997
2.555 bln
+533.374 mln
26.38%
jan 1, 1998
2.999 bln
+443.677 mln
17.36%
jan 1, 1999
2.759 bln
-240.344 mln
-8.01%
jan 1, 2000
2.515 bln
-243.649 mln
-8.83%
jan 1, 2001
3.261 bln
+746.322 mln
29.67%
jan 1, 2002
3.352 bln
+90.325 mln
2.77%
jan 1, 2003
4.15 bln
+798.449 mln
23.82%
jan 1, 2004
6.707 bln
+2.557 bln
61.61%
jan 1, 2005
6.502 bln
-205.357 mln
-3.06%
jan 1, 2006
6.137 bln
-365.083 mln
-5.62%
jan 1, 2007
12.032 bln
+5.896 bln
96.08%
jan 1, 2008
15.407 bln
+3.375 bln
28.05%
jan 1, 2009
17.331 bln
+1.924 bln
12.49%
jan 1, 2010
20.498 bln
+3.167 bln
18.27%
jan 1, 2011
63.814 bln
+43.316 bln
211.31%
jan 1, 2012
66.752 bln
+2.938 bln
4.6%
jan 1, 2013
68.718 bln
+1.966 bln
2.94%
jan 1, 2014
76.75 bln
+8.033 bln
11.69%
jan 1, 2015
89.838 bln
+13.088 bln
17.05%
jan 1, 2016
74.518 bln
-15.321 bln
-17.05%
Ranking of countries by current statistics by years


Comments: