29
/
en
AIzaSyAYiBZKx7MnpbEhh9jyipgxe19OcubqV5w
April 1, 2024
279832
Vanuatu
VUT
true
2
1
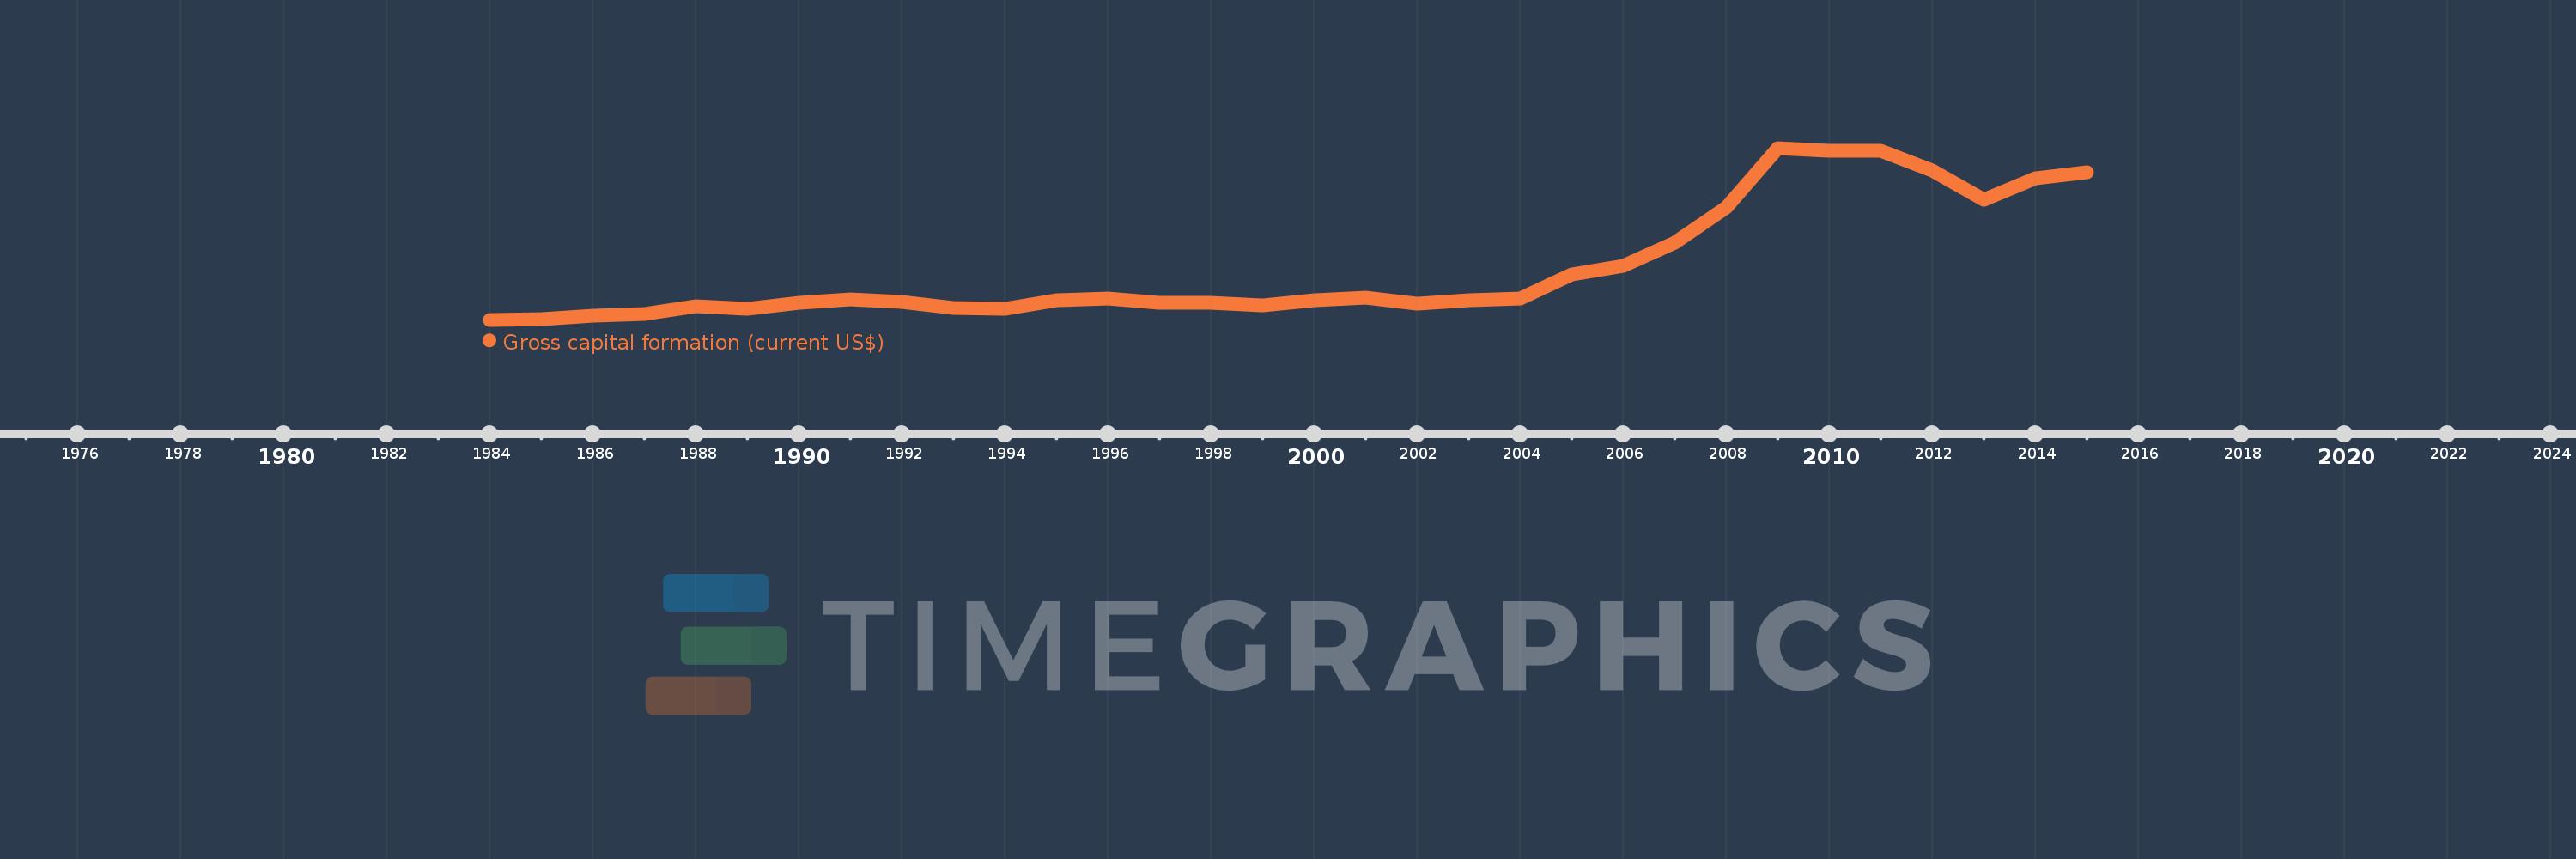
Gross capital formation (current US$)
2015,2014,2013,2012,2011,2010,2009,2008,2007,2006,2005,2004,2003,2002,2001,2000,1999,1998,1997,1996,1995,1994,1993,1992,1991,1990,1989,1988,1987,1986,1985,1984
This statistics in other country:
AfghanistanAlbaniaAlgeriaAngolaAntigua and BarbudaArab WorldArgentinaArmeniaArubaAustraliaAustriaAzerbaijanBahamas, TheBahrainBangladeshBarbadosBelarusBelgiumBelizeBeninBermudaBhutanBoliviaBosnia and HerzegovinaBotswanaBrazilBrunei DarussalamBulgariaBurkina FasoBurundiCabo VerdeCambodiaCameroonCanadaCaribbean small statesCentral African RepublicCentral Europe and the BalticsChadChileChinaColombiaComorosCongo, Dem. Rep.Congo, Rep.Costa RicaCote d'IvoireCroatiaCubaCyprusCzech RepublicDenmarkDjiboutiDominicaDominican RepublicEarly-demographic dividendEast Asia & PacificEast Asia & Pacific (excluding high income)East Asia & Pacific (IDA & IBRD countries)EcuadorEgypt, Arab Rep.El SalvadorEquatorial GuineaEritreaEstoniaEthiopiaEuro areaEurope & Central AsiaEurope & Central Asia (excluding high income)Europe & Central Asia (IDA & IBRD countries)European UnionFaroe IslandsFijiFinlandFragile and conflict affected situationsFranceGabonGambia, TheGeorgiaGermanyGhanaGreeceGrenadaGuatemalaGuineaGuinea-BissauGuyanaHaitiHeavily indebted poor countries (HIPC)High incomeHondurasHong Kong SAR, ChinaHungaryIBRD onlyIcelandIDA & IBRD totalIDA blendIDA onlyIDA totalIndiaIndonesiaIran, Islamic Rep.IraqIrelandIsraelItalyJamaicaJapanJordanKazakhstanKenyaKiribatiKorea, Rep.KosovoKuwaitKyrgyz RepublicLao PDRLate-demographic dividendLatin America & Caribbean Latin America & Caribbean (excluding high income)Latin America & the Caribbean (IDA & IBRD countries)LatviaLeast developed countries: UN classificationLebanonLesothoLiberiaLibyaLithuaniaLow & middle incomeLow incomeLower middle incomeLuxembourgMacao SAR, ChinaMacedonia, FYRMadagascarMalawiMalaysiaMaldivesMaliMaltaMauritaniaMauritiusMexicoMicronesia, Fed. Sts.Middle East & North AfricaMiddle East & North Africa (excluding high income)Middle East & North Africa (IDA & IBRD countries)Middle incomeMoldovaMongoliaMontenegroMoroccoMozambiqueNamibiaNepalNetherlandsNew CaledoniaNew ZealandNicaraguaNigerNigeriaNorth AmericaNorwayOECD membersOmanOther small statesPakistanPanamaPapua New GuineaParaguayPeruPhilippinesPolandPortugalPost-demographic dividendPre-demographic dividendPuerto RicoQatarRomaniaRussian FederationRwandaSaudi ArabiaSenegalSerbiaSeychellesSierra LeoneSingaporeSlovak RepublicSloveniaSmall statesSolomon IslandsSouth AfricaSouth AsiaSouth Asia (IDA & IBRD)South SudanSpainSri LankaSt. Kitts and NevisSt. LuciaSt. Vincent and the GrenadinesSub-Saharan Africa Sub-Saharan Africa (excluding high income)Sub-Saharan Africa (IDA & IBRD countries)SudanSurinameSwazilandSwedenSwitzerlandSyrian Arab RepublicTajikistanTanzaniaThailandTimor-LesteTogoTongaTrinidad and TobagoTunisiaTurkeyTurkmenistanUgandaUkraineUnited Arab EmiratesUnited KingdomUnited StatesUpper middle incomeUruguayUzbekistanVanuatuVenezuela, RBVietnamWest Bank and GazaWorldYemen, Rep.ZambiaZimbabwe Timeline:
This timeline shows a graph from 1984 to 2015 of Vanuatu. No data until 1983. Number of actual observations by date: 32.
Source name:
World Development Indicators
Source organization:
World Bank national accounts data, and OECD National Accounts data files.
Categories, topics:
Economy & Growth
Last updated:
apr 23, 2017
Indicators value changes by year
Minimum:
26.215 mln
jan 1, 1984
Maximum:
246.58 mln
jan 1, 2009
At the date of observation
Value
Absolute change
Change from previous value
jan 1, 1984
26.215 mln
+26.215 mln
0.0%
jan 1, 1985
26.927 mln
+712.184K
2.72%
jan 1, 1986
31.943 mln
+5.016 mln
18.63%
jan 1, 1987
33.929 mln
+1.986 mln
6.22%
jan 1, 1988
43.323 mln
+9.394 mln
27.69%
jan 1, 1989
39.684 mln
-3.64 mln
-8.4%
jan 1, 1990
47.707 mln
+8.023 mln
20.22%
jan 1, 1991
52.631 mln
+4.924 mln
10.32%
jan 1, 1992
49.239 mln
-3.392 mln
-6.45%
jan 1, 1993
41.343 mln
-7.896 mln
-16.04%
jan 1, 1994
39.949 mln
-1.395 mln
-3.37%
jan 1, 1995
50.883 mln
+10.934 mln
27.37%
jan 1, 1996
52.948 mln
+2.065 mln
4.06%
jan 1, 1997
48.336 mln
-4.612 mln
-8.71%
jan 1, 1998
48.201 mln
-134.987K
-0.28%
jan 1, 1999
44.974 mln
-3.226 mln
-6.69%
jan 1, 2000
50.901 mln
+5.926 mln
13.18%
jan 1, 2001
54.169 mln
+3.268 mln
6.42%
jan 1, 2002
47.339 mln
-6.83 mln
-12.61%
jan 1, 2003
51.322 mln
+3.983 mln
8.41%
jan 1, 2004
52.975 mln
+1.653 mln
3.22%
jan 1, 2005
84.82 mln
+31.845 mln
60.11%
jan 1, 2006
95.262 mln
+10.442 mln
12.31%
jan 1, 2007
124.683 mln
+29.421 mln
30.88%
jan 1, 2008
169.86 mln
+45.177 mln
36.23%
jan 1, 2009
246.58 mln
+76.72 mln
45.17%
jan 1, 2010
243.375 mln
-3.206 mln
-1.3%
jan 1, 2011
242.896 mln
-478.927K
-0.2%
jan 1, 2012
217.818 mln
-25.078 mln
-10.32%
jan 1, 2013
180.143 mln
-37.675 mln
-17.3%
jan 1, 2014
207.822 mln
+27.679 mln
15.36%
jan 1, 2015
215.397 mln
+7.576 mln
3.65%
Ranking of countries by current statistics by years


Comments: