29
/
en
AIzaSyAYiBZKx7MnpbEhh9jyipgxe19OcubqV5w
April 1, 2024
282338
Vietnam
VNM
true
2
1
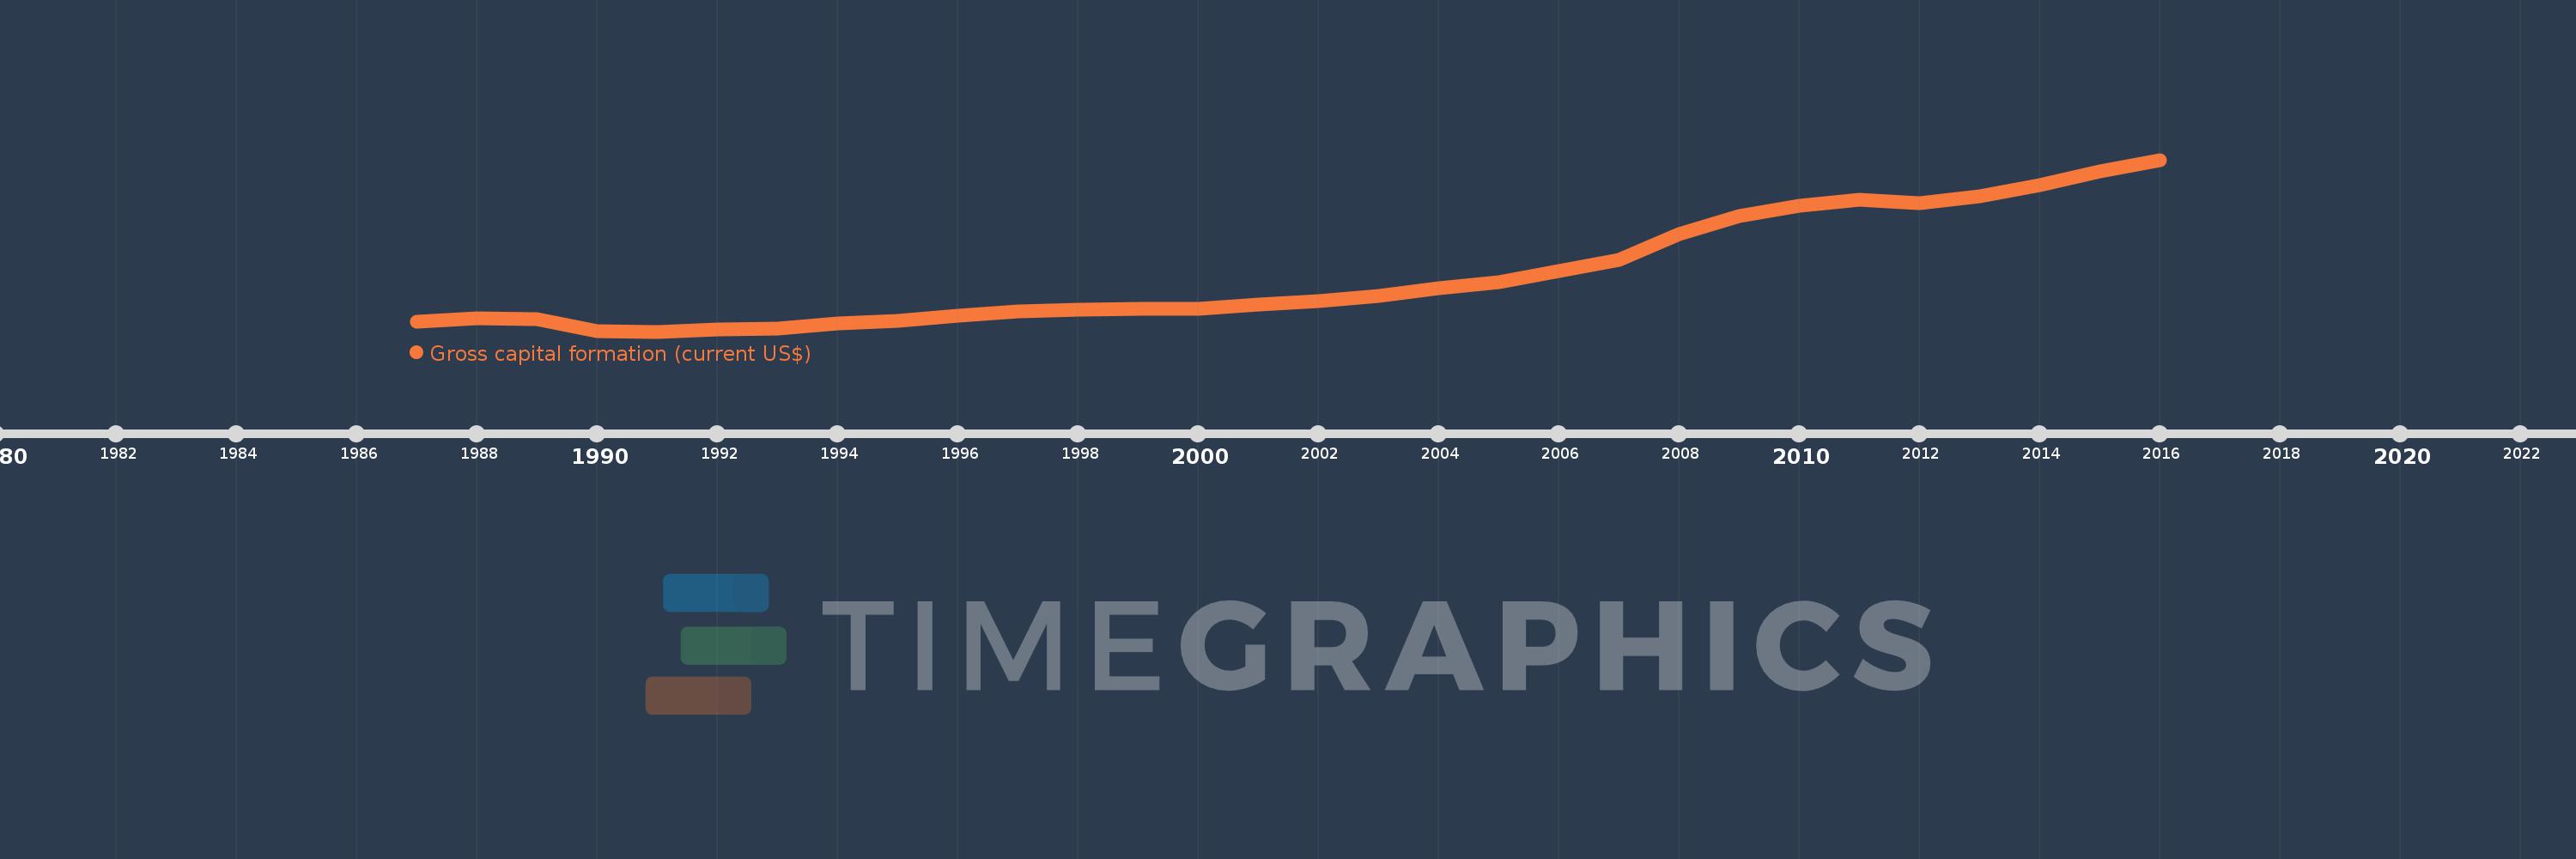
Gross capital formation (current US$)
2016,2015,2014,2013,2012,2011,2010,2009,2008,2007,2006,2005,2004,2003,2002,2001,2000,1999,1998,1997,1996,1995,1994,1993,1992,1991,1990,1989,1988,1987
This statistics in other country:
AfghanistanAlbaniaAlgeriaAngolaAntigua and BarbudaArab WorldArgentinaArmeniaArubaAustraliaAustriaAzerbaijanBahamas, TheBahrainBangladeshBarbadosBelarusBelgiumBelizeBeninBermudaBhutanBoliviaBosnia and HerzegovinaBotswanaBrazilBrunei DarussalamBulgariaBurkina FasoBurundiCabo VerdeCambodiaCameroonCanadaCaribbean small statesCentral African RepublicCentral Europe and the BalticsChadChileChinaColombiaComorosCongo, Dem. Rep.Congo, Rep.Costa RicaCote d'IvoireCroatiaCubaCyprusCzech RepublicDenmarkDjiboutiDominicaDominican RepublicEarly-demographic dividendEast Asia & PacificEast Asia & Pacific (excluding high income)East Asia & Pacific (IDA & IBRD countries)EcuadorEgypt, Arab Rep.El SalvadorEquatorial GuineaEritreaEstoniaEthiopiaEuro areaEurope & Central AsiaEurope & Central Asia (excluding high income)Europe & Central Asia (IDA & IBRD countries)European UnionFaroe IslandsFijiFinlandFragile and conflict affected situationsFranceGabonGambia, TheGeorgiaGermanyGhanaGreeceGrenadaGuatemalaGuineaGuinea-BissauGuyanaHaitiHeavily indebted poor countries (HIPC)High incomeHondurasHong Kong SAR, ChinaHungaryIBRD onlyIcelandIDA & IBRD totalIDA blendIDA onlyIDA totalIndiaIndonesiaIran, Islamic Rep.IraqIrelandIsraelItalyJamaicaJapanJordanKazakhstanKenyaKiribatiKorea, Rep.KosovoKuwaitKyrgyz RepublicLao PDRLate-demographic dividendLatin America & Caribbean Latin America & Caribbean (excluding high income)Latin America & the Caribbean (IDA & IBRD countries)LatviaLeast developed countries: UN classificationLebanonLesothoLiberiaLibyaLithuaniaLow & middle incomeLow incomeLower middle incomeLuxembourgMacao SAR, ChinaMacedonia, FYRMadagascarMalawiMalaysiaMaldivesMaliMaltaMauritaniaMauritiusMexicoMicronesia, Fed. Sts.Middle East & North AfricaMiddle East & North Africa (excluding high income)Middle East & North Africa (IDA & IBRD countries)Middle incomeMoldovaMongoliaMontenegroMoroccoMozambiqueNamibiaNepalNetherlandsNew CaledoniaNew ZealandNicaraguaNigerNigeriaNorth AmericaNorwayOECD membersOmanOther small statesPakistanPanamaPapua New GuineaParaguayPeruPhilippinesPolandPortugalPost-demographic dividendPre-demographic dividendPuerto RicoQatarRomaniaRussian FederationRwandaSaudi ArabiaSenegalSerbiaSeychellesSierra LeoneSingaporeSlovak RepublicSloveniaSmall statesSolomon IslandsSouth AfricaSouth AsiaSouth Asia (IDA & IBRD)South SudanSpainSri LankaSt. Kitts and NevisSt. LuciaSt. Vincent and the GrenadinesSub-Saharan Africa Sub-Saharan Africa (excluding high income)Sub-Saharan Africa (IDA & IBRD countries)SudanSurinameSwazilandSwedenSwitzerlandSyrian Arab RepublicTajikistanTanzaniaThailandTimor-LesteTogoTongaTrinidad and TobagoTunisiaTurkeyTurkmenistanUgandaUkraineUnited Arab EmiratesUnited KingdomUnited StatesUpper middle incomeUruguayUzbekistanVanuatuVenezuela, RBVietnamWest Bank and GazaWorldYemen, Rep.ZambiaZimbabwe Timeline:
This timeline shows a graph from 1987 to 2016 of Vietnam. No data until 1986. Number of actual observations by date: 30.
Source name:
World Development Indicators
Source organization:
World Bank national accounts data, and OECD National Accounts data files.
Categories, topics:
Economy & Growth
Last updated:
apr 23, 2017
Indicators value changes by year
Minimum:
813.229 mln
jan 1, 1991
Maximum:
53.582 bln
jan 1, 2016
At the date of observation
Value
Absolute change
Change from previous value
jan 1, 1987
3.799 bln
+3.799 bln
0.0%
jan 1, 1988
4.971 bln
+1.172 bln
30.86%
jan 1, 1989
4.537 bln
-434.481 mln
-8.74%
jan 1, 1990
920.754 mln
-3.616 bln
-79.7%
jan 1, 1991
813.229 mln
-107.525 mln
-11.68%
jan 1, 1992
1.449 bln
+635.538 mln
78.15%
jan 1, 1993
1.741 bln
+291.784 mln
20.14%
jan 1, 1994
3.197 bln
+1.457 bln
83.68%
jan 1, 1995
4.149 bln
+952.022 mln
29.78%
jan 1, 1996
5.629 bln
+1.48 bln
35.66%
jan 1, 1997
6.929 bln
+1.301 bln
23.11%
jan 1, 1998
7.597 bln
+667.191 mln
9.63%
jan 1, 1999
7.904 bln
+307.701 mln
4.05%
jan 1, 2000
7.925 bln
+20.869 mln
0.26%
jan 1, 2001
9.23 bln
+1.305 bln
16.47%
jan 1, 2002
10.189 bln
+958.727 mln
10.39%
jan 1, 2003
11.648 bln
+1.46 bln
14.33%
jan 1, 2004
14.019 bln
+2.371 bln
20.35%
jan 1, 2005
16.111 bln
+2.092 bln
14.92%
jan 1, 2006
19.455 bln
+3.344 bln
20.76%
jan 1, 2007
22.923 bln
+3.467 bln
17.82%
jan 1, 2008
30.63 bln
+7.707 bln
33.62%
jan 1, 2009
36.176 bln
+5.546 bln
18.11%
jan 1, 2010
39.398 bln
+3.222 bln
8.91%
jan 1, 2011
41.38 bln
+1.983 bln
5.03%
jan 1, 2012
40.324 bln
-1.057 bln
-2.55%
jan 1, 2013
42.451 bln
+2.127 bln
5.27%
jan 1, 2014
45.675 bln
+3.224 bln
7.59%
jan 1, 2015
49.964 bln
+4.289 bln
9.39%
jan 1, 2016
53.582 bln
+3.618 bln
7.24%
Ranking of countries by current statistics by years


Comments: