29
/
en
AIzaSyAYiBZKx7MnpbEhh9jyipgxe19OcubqV5w
April 1, 2024
255223
Swaziland
SWZ
true
2
1
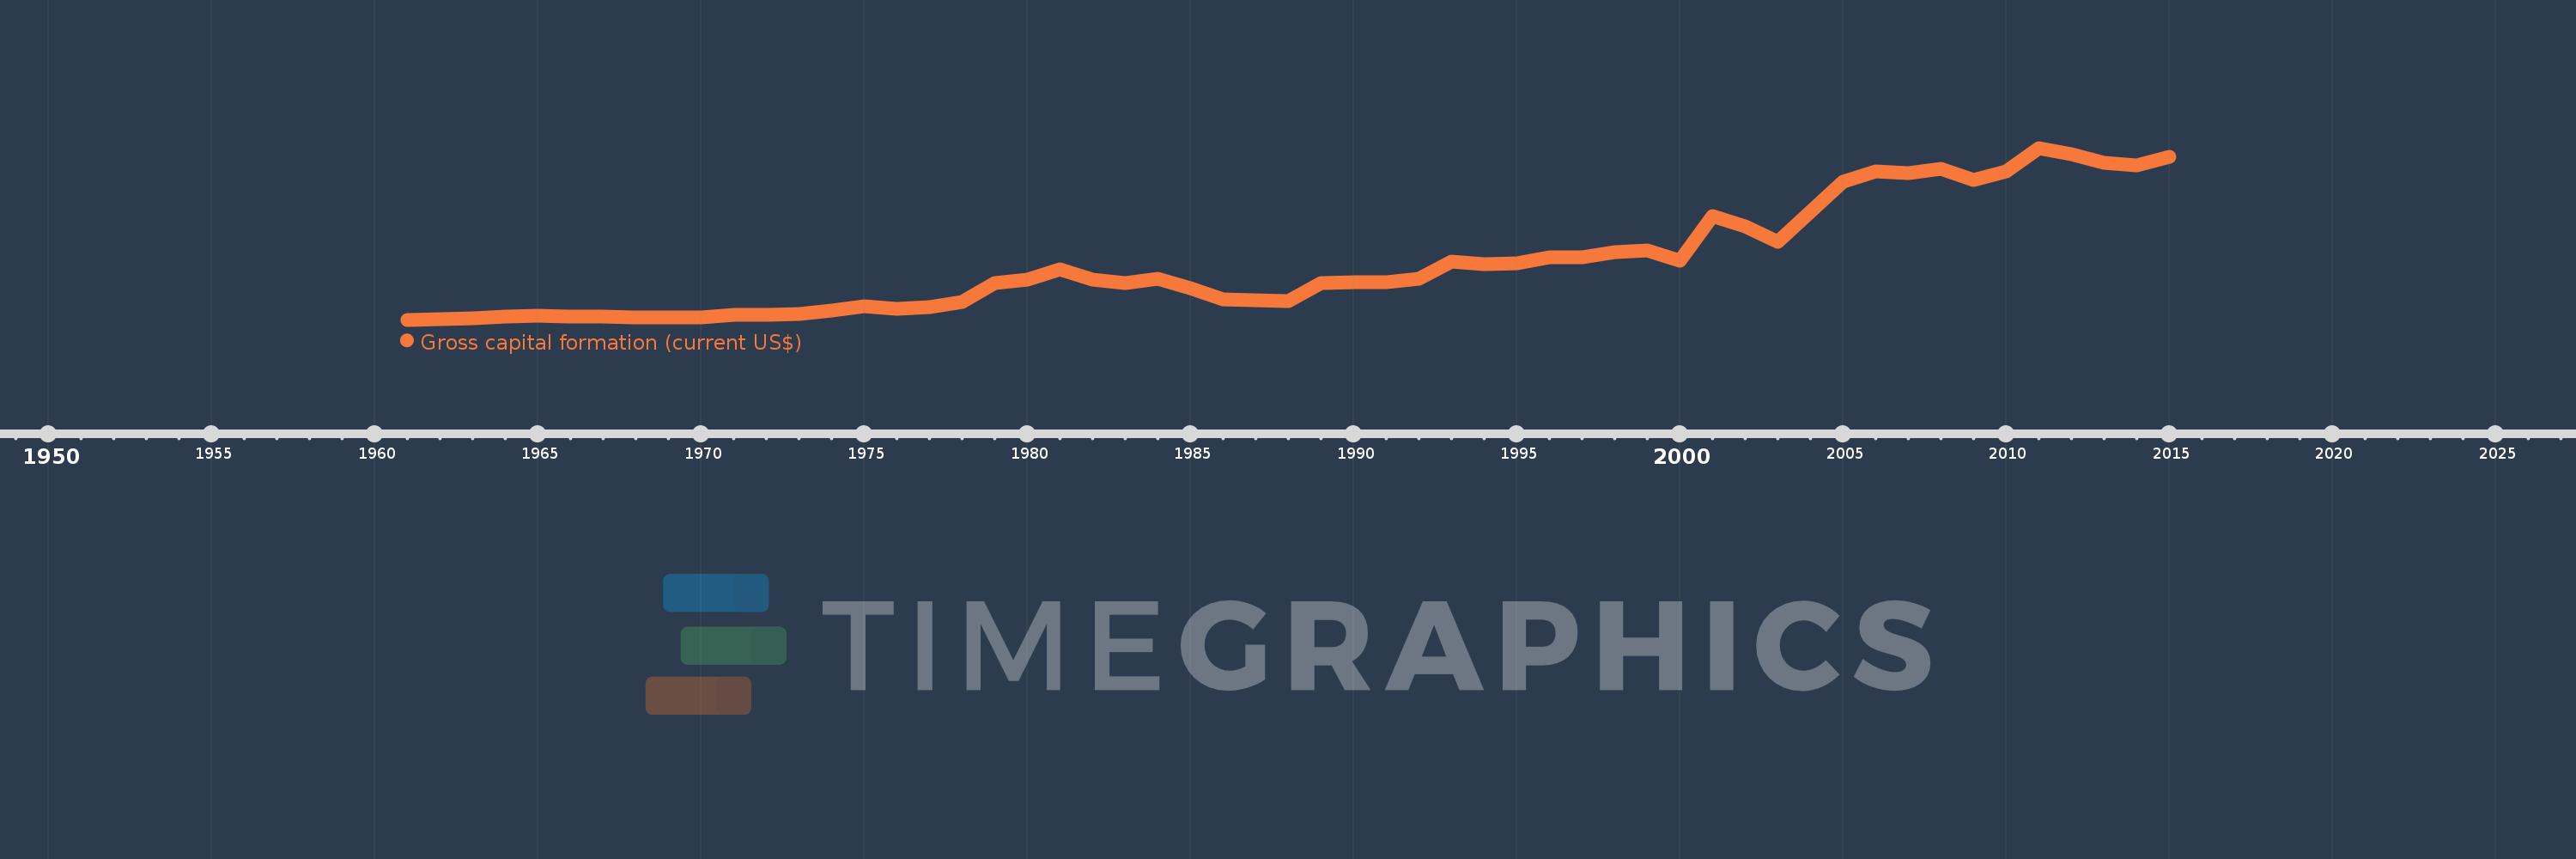
Gross capital formation (current US$)
2015,2014,2013,2012,2011,2010,2009,2008,2007,2006,2005,2004,2003,2002,2001,2000,1999,1998,1997,1996,1995,1994,1993,1992,1991,1990,1989,1988,1987,1986,1985,1984,1983,1982,1981,1980,1979,1978,1977,1976,1975,1974,1973,1972,1971,1970,1969,1968,1967,1966,1965,1964,1963,1962,1961
This statistics in other country:
AfghanistanAlbaniaAlgeriaAngolaAntigua and BarbudaArab WorldArgentinaArmeniaArubaAustraliaAustriaAzerbaijanBahamas, TheBahrainBangladeshBarbadosBelarusBelgiumBelizeBeninBermudaBhutanBoliviaBosnia and HerzegovinaBotswanaBrazilBrunei DarussalamBulgariaBurkina FasoBurundiCabo VerdeCambodiaCameroonCanadaCaribbean small statesCentral African RepublicCentral Europe and the BalticsChadChileChinaColombiaComorosCongo, Dem. Rep.Congo, Rep.Costa RicaCote d'IvoireCroatiaCubaCyprusCzech RepublicDenmarkDjiboutiDominicaDominican RepublicEarly-demographic dividendEast Asia & PacificEast Asia & Pacific (excluding high income)East Asia & Pacific (IDA & IBRD countries)EcuadorEgypt, Arab Rep.El SalvadorEquatorial GuineaEritreaEstoniaEthiopiaEuro areaEurope & Central AsiaEurope & Central Asia (excluding high income)Europe & Central Asia (IDA & IBRD countries)European UnionFaroe IslandsFijiFinlandFragile and conflict affected situationsFranceGabonGambia, TheGeorgiaGermanyGhanaGreeceGrenadaGuatemalaGuineaGuinea-BissauGuyanaHaitiHeavily indebted poor countries (HIPC)High incomeHondurasHong Kong SAR, ChinaHungaryIBRD onlyIcelandIDA & IBRD totalIDA blendIDA onlyIDA totalIndiaIndonesiaIran, Islamic Rep.IraqIrelandIsraelItalyJamaicaJapanJordanKazakhstanKenyaKiribatiKorea, Rep.KosovoKuwaitKyrgyz RepublicLao PDRLate-demographic dividendLatin America & Caribbean Latin America & Caribbean (excluding high income)Latin America & the Caribbean (IDA & IBRD countries)LatviaLeast developed countries: UN classificationLebanonLesothoLiberiaLibyaLithuaniaLow & middle incomeLow incomeLower middle incomeLuxembourgMacao SAR, ChinaMacedonia, FYRMadagascarMalawiMalaysiaMaldivesMaliMaltaMauritaniaMauritiusMexicoMicronesia, Fed. Sts.Middle East & North AfricaMiddle East & North Africa (excluding high income)Middle East & North Africa (IDA & IBRD countries)Middle incomeMoldovaMongoliaMontenegroMoroccoMozambiqueNamibiaNepalNetherlandsNew CaledoniaNew ZealandNicaraguaNigerNigeriaNorth AmericaNorwayOECD membersOmanOther small statesPakistanPanamaPapua New GuineaParaguayPeruPhilippinesPolandPortugalPost-demographic dividendPre-demographic dividendPuerto RicoQatarRomaniaRussian FederationRwandaSaudi ArabiaSenegalSerbiaSeychellesSierra LeoneSingaporeSlovak RepublicSloveniaSmall statesSolomon IslandsSouth AfricaSouth AsiaSouth Asia (IDA & IBRD)South SudanSpainSri LankaSt. Kitts and NevisSt. LuciaSt. Vincent and the GrenadinesSub-Saharan Africa Sub-Saharan Africa (excluding high income)Sub-Saharan Africa (IDA & IBRD countries)SudanSurinameSwazilandSwedenSwitzerlandSyrian Arab RepublicTajikistanTanzaniaThailandTimor-LesteTogoTongaTrinidad and TobagoTunisiaTurkeyTurkmenistanUgandaUkraineUnited Arab EmiratesUnited KingdomUnited StatesUpper middle incomeUruguayUzbekistanVanuatuVenezuela, RBVietnamWest Bank and GazaWorldYemen, Rep.ZambiaZimbabwe Timeline:
This timeline shows a graph from 1961 to 2015 of Swaziland. No data until 1960. Number of actual observations by date: 55.
Source name:
World Development Indicators
Source organization:
World Bank national accounts data, and OECD National Accounts data files.
Categories, topics:
Economy & Growth
Last updated:
apr 23, 2017
Indicators value changes by year
Minimum:
6.72 mln
jan 1, 1961
Maximum:
739.086 mln
jan 1, 2011
At the date of observation
Value
Absolute change
Change from previous value
jan 1, 1961
6.72 mln
+6.72 mln
0.0%
jan 1, 1962
10.08 mln
+3.36 mln
50.0%
jan 1, 1963
14.56 mln
+4.48 mln
44.44%
jan 1, 1964
18.9 mln
+4.34 mln
29.81%
jan 1, 1965
24.64 mln
+5.74 mln
30.37%
jan 1, 1966
20.16 mln
-4.48 mln
-18.18%
jan 1, 1967
20.44 mln
+279.994K
1.39%
jan 1, 1968
17.5 mln
-2.94 mln
-14.38%
jan 1, 1969
15.68 mln
-1.82 mln
-10.4%
jan 1, 1970
17.22 mln
+1.54 mln
9.82%
jan 1, 1971
25.918 mln
+8.698 mln
50.51%
jan 1, 1972
27.144 mln
+1.226 mln
4.73%
jan 1, 1973
31.373 mln
+4.229 mln
15.58%
jan 1, 1974
44.7 mln
+13.326 mln
42.48%
jan 1, 1975
63.031 mln
+18.331 mln
41.01%
jan 1, 1976
53.555 mln
-9.476 mln
-15.03%
jan 1, 1977
60.488 mln
+6.933 mln
12.95%
jan 1, 1978
81.877 mln
+21.389 mln
35.36%
jan 1, 1979
163.178 mln
+81.302 mln
99.3%
jan 1, 1980
175.933 mln
+12.754 mln
7.82%
jan 1, 1981
220.339 mln
+44.406 mln
25.24%
jan 1, 1982
177.43 mln
-42.909 mln
-19.47%
jan 1, 1983
162.286 mln
-15.145 mln
-8.54%
jan 1, 1984
182.03 mln
+19.744 mln
12.17%
jan 1, 1985
141.937 mln
-40.093 mln
-22.03%
jan 1, 1986
94.651 mln
-47.286 mln
-33.31%
jan 1, 1987
89.628 mln
-5.023 mln
-5.31%
jan 1, 1988
86.788 mln
-2.84 mln
-3.17%
jan 1, 1989
162.965 mln
+76.177 mln
87.77%
jan 1, 1990
166.775 mln
+3.81 mln
2.34%
jan 1, 1991
168.477 mln
+1.702 mln
1.02%
jan 1, 1992
180.929 mln
+12.452 mln
7.39%
jan 1, 1993
253.331 mln
+72.402 mln
40.02%
jan 1, 1994
245.065 mln
-8.266 mln
-3.26%
jan 1, 1995
246.311 mln
+1.245 mln
0.51%
jan 1, 1996
272.229 mln
+25.918 mln
10.52%
jan 1, 1997
272.99 mln
+761.845K
0.28%
jan 1, 1998
295.573 mln
+22.583 mln
8.27%
jan 1, 1999
301.25 mln
+5.677 mln
1.92%
jan 1, 2000
258.139 mln
-43.111 mln
-14.31%
jan 1, 2001
449.725 mln
+191.586 mln
74.22%
jan 1, 2002
403.759 mln
-45.966 mln
-10.22%
jan 1, 2003
338.877 mln
-64.882 mln
-16.07%
jan 1, 2004
467.038 mln
+128.161 mln
37.82%
jan 1, 2005
596.322 mln
+129.284 mln
27.68%
jan 1, 2006
638.907 mln
+42.585 mln
7.14%
jan 1, 2007
630.732 mln
-8.175 mln
-1.28%
jan 1, 2008
651.773 mln
+21.041 mln
3.34%
jan 1, 2009
601.123 mln
-50.649 mln
-7.77%
jan 1, 2010
638.328 mln
+37.205 mln
6.19%
jan 1, 2011
739.086 mln
+100.758 mln
15.78%
jan 1, 2012
711.876 mln
-27.211 mln
-3.68%
jan 1, 2013
675.518 mln
-36.358 mln
-5.11%
jan 1, 2014
663.069 mln
-12.448 mln
-1.84%
jan 1, 2015
700.01 mln
+36.941 mln
5.57%
Ranking of countries by current statistics by years


Comments: