29
/
en
AIzaSyAYiBZKx7MnpbEhh9jyipgxe19OcubqV5w
April 1, 2024
257353
Switzerland
CHE
true
2
1
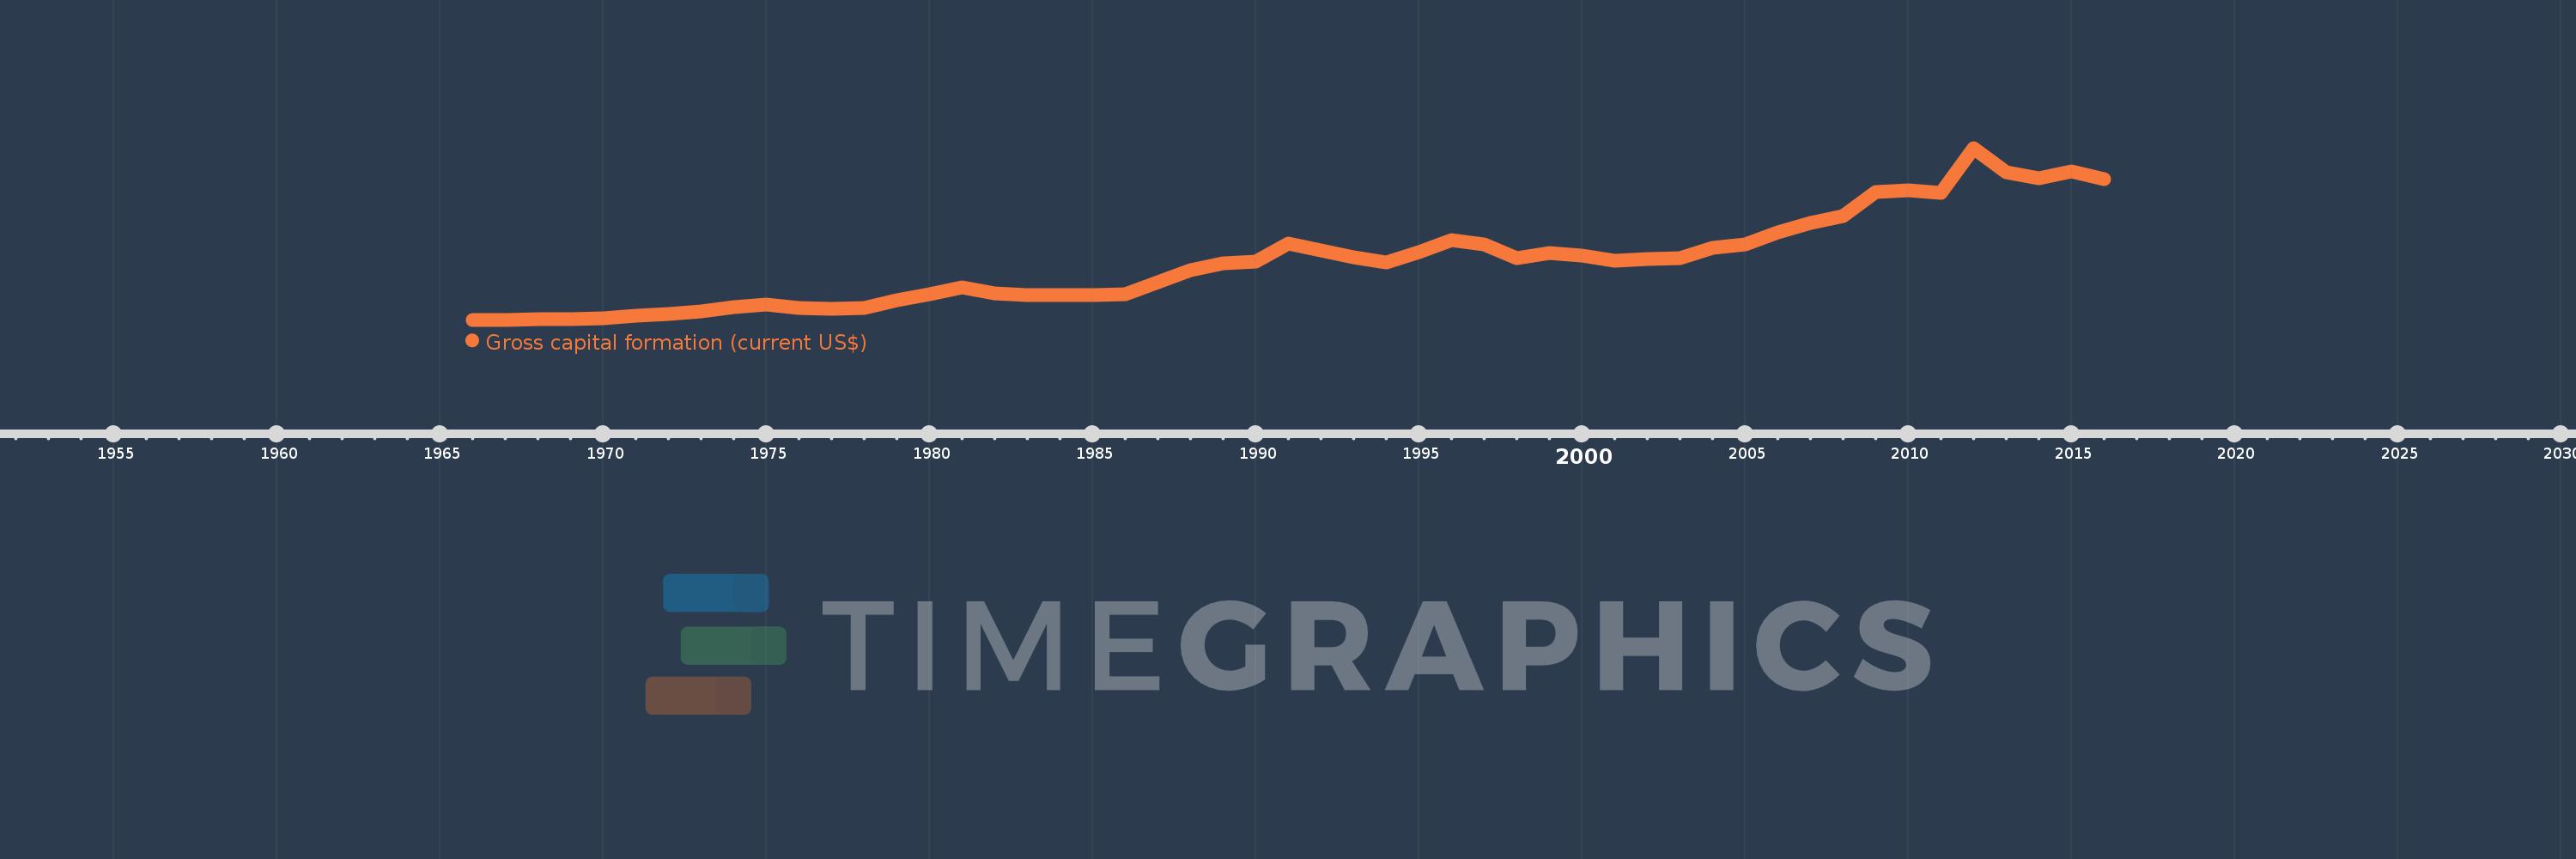
Gross capital formation (current US$)
2016,2015,2014,2013,2012,2011,2010,2009,2008,2007,2006,2005,2004,2003,2002,2001,2000,1999,1998,1997,1996,1995,1994,1993,1992,1991,1990,1989,1988,1987,1986,1985,1984,1983,1982,1981,1980,1979,1978,1977,1976,1975,1974,1973,1972,1971,1970,1969,1968,1967,1966
This statistics in other country:
AfghanistanAlbaniaAlgeriaAngolaAntigua and BarbudaArab WorldArgentinaArmeniaArubaAustraliaAustriaAzerbaijanBahamas, TheBahrainBangladeshBarbadosBelarusBelgiumBelizeBeninBermudaBhutanBoliviaBosnia and HerzegovinaBotswanaBrazilBrunei DarussalamBulgariaBurkina FasoBurundiCabo VerdeCambodiaCameroonCanadaCaribbean small statesCentral African RepublicCentral Europe and the BalticsChadChileChinaColombiaComorosCongo, Dem. Rep.Congo, Rep.Costa RicaCote d'IvoireCroatiaCubaCyprusCzech RepublicDenmarkDjiboutiDominicaDominican RepublicEarly-demographic dividendEast Asia & PacificEast Asia & Pacific (excluding high income)East Asia & Pacific (IDA & IBRD countries)EcuadorEgypt, Arab Rep.El SalvadorEquatorial GuineaEritreaEstoniaEthiopiaEuro areaEurope & Central AsiaEurope & Central Asia (excluding high income)Europe & Central Asia (IDA & IBRD countries)European UnionFaroe IslandsFijiFinlandFragile and conflict affected situationsFranceGabonGambia, TheGeorgiaGermanyGhanaGreeceGrenadaGuatemalaGuineaGuinea-BissauGuyanaHaitiHeavily indebted poor countries (HIPC)High incomeHondurasHong Kong SAR, ChinaHungaryIBRD onlyIcelandIDA & IBRD totalIDA blendIDA onlyIDA totalIndiaIndonesiaIran, Islamic Rep.IraqIrelandIsraelItalyJamaicaJapanJordanKazakhstanKenyaKiribatiKorea, Rep.KosovoKuwaitKyrgyz RepublicLao PDRLate-demographic dividendLatin America & Caribbean Latin America & Caribbean (excluding high income)Latin America & the Caribbean (IDA & IBRD countries)LatviaLeast developed countries: UN classificationLebanonLesothoLiberiaLibyaLithuaniaLow & middle incomeLow incomeLower middle incomeLuxembourgMacao SAR, ChinaMacedonia, FYRMadagascarMalawiMalaysiaMaldivesMaliMaltaMauritaniaMauritiusMexicoMicronesia, Fed. Sts.Middle East & North AfricaMiddle East & North Africa (excluding high income)Middle East & North Africa (IDA & IBRD countries)Middle incomeMoldovaMongoliaMontenegroMoroccoMozambiqueNamibiaNepalNetherlandsNew CaledoniaNew ZealandNicaraguaNigerNigeriaNorth AmericaNorwayOECD membersOmanOther small statesPakistanPanamaPapua New GuineaParaguayPeruPhilippinesPolandPortugalPost-demographic dividendPre-demographic dividendPuerto RicoQatarRomaniaRussian FederationRwandaSaudi ArabiaSenegalSerbiaSeychellesSierra LeoneSingaporeSlovak RepublicSloveniaSmall statesSolomon IslandsSouth AfricaSouth AsiaSouth Asia (IDA & IBRD)South SudanSpainSri LankaSt. Kitts and NevisSt. LuciaSt. Vincent and the GrenadinesSub-Saharan Africa Sub-Saharan Africa (excluding high income)Sub-Saharan Africa (IDA & IBRD countries)SudanSurinameSwazilandSwedenSwitzerlandSyrian Arab RepublicTajikistanTanzaniaThailandTimor-LesteTogoTongaTrinidad and TobagoTunisiaTurkeyTurkmenistanUgandaUkraineUnited Arab EmiratesUnited KingdomUnited StatesUpper middle incomeUruguayUzbekistanVanuatuVenezuela, RBVietnamWest Bank and GazaWorldYemen, Rep.ZambiaZimbabwe Timeline:
This timeline shows a graph from 1966 to 2016 of Switzerland. No data until 1965. Number of actual observations by date: 51.
Source name:
World Development Indicators
Source organization:
World Bank national accounts data, and OECD National Accounts data files.
Categories, topics:
Economy & Growth
Last updated:
apr 23, 2017
Indicators value changes by year
Minimum:
5.181 bln
jan 1, 1966
Maximum:
187.076 bln
jan 1, 2012
At the date of observation
Value
Absolute change
Change from previous value
jan 1, 1966
5.181 bln
+5.181 bln
0.0%
jan 1, 1967
5.354 bln
+173.273 mln
3.34%
jan 1, 1968
5.686 bln
+332.062 mln
6.2%
jan 1, 1969
5.871 bln
+185.309 mln
3.26%
jan 1, 1970
6.406 bln
+534.38 mln
9.1%
jan 1, 1971
9.536 bln
+3.131 bln
48.87%
jan 1, 1972
11.538 bln
+2.002 bln
20.99%
jan 1, 1973
13.85 bln
+2.311 bln
20.03%
jan 1, 1974
18.356 bln
+4.507 bln
32.54%
jan 1, 1975
21.1 bln
+2.744 bln
14.95%
jan 1, 1976
17.788 bln
-3.312 bln
-15.7%
jan 1, 1977
16.792 bln
-995.973 mln
-5.6%
jan 1, 1978
17.938 bln
+1.146 bln
6.82%
jan 1, 1979
26.259 bln
+8.32 bln
46.38%
jan 1, 1980
32.453 bln
+6.194 bln
23.59%
jan 1, 1981
39.417 bln
+6.964 bln
21.46%
jan 1, 1982
33.488 bln
-5.929 bln
-15.04%
jan 1, 1983
31.621 bln
-1.867 bln
-5.57%
jan 1, 1984
30.842 bln
-779.135 mln
-2.46%
jan 1, 1985
31.372 bln
+530.006 mln
1.72%
jan 1, 1986
31.843 bln
+471.194 mln
1.5%
jan 1, 1987
45.311 bln
+13.468 bln
42.29%
jan 1, 1988
57.418 bln
+12.107 bln
26.72%
jan 1, 1989
65.33 bln
+7.912 bln
13.78%
jan 1, 1990
66.339 bln
+1.009 bln
1.54%
jan 1, 1991
85.527 bln
+19.188 bln
28.92%
jan 1, 1992
78.972 bln
-6.555 bln
-7.66%
jan 1, 1993
71.702 bln
-7.27 bln
-9.21%
jan 1, 1994
65.602 bln
-6.1 bln
-8.51%
jan 1, 1995
76.649 bln
+11.047 bln
16.84%
jan 1, 1996
89.392 bln
+12.744 bln
16.63%
jan 1, 1997
85.107 bln
-4.285 bln
-4.79%
jan 1, 1998
70.377 bln
-14.73 bln
-17.31%
jan 1, 1999
75.666 bln
+5.29 bln
7.52%
jan 1, 2000
73.157 bln
-2.51 bln
-3.32%
jan 1, 2001
67.939 bln
-5.218 bln
-7.13%
jan 1, 2002
69.758 bln
+1.819 bln
2.68%
jan 1, 2003
70.755 bln
+997.244 mln
1.43%
jan 1, 2004
81.49 bln
+10.735 bln
15.17%
jan 1, 2005
84.735 bln
+3.245 bln
3.98%
jan 1, 2006
97.926 bln
+13.191 bln
15.57%
jan 1, 2007
107.504 bln
+9.578 bln
9.78%
jan 1, 2008
114.92 bln
+7.416 bln
6.9%
jan 1, 2009
140.183 bln
+25.263 bln
21.98%
jan 1, 2010
142.381 bln
+2.197 bln
1.57%
jan 1, 2011
139.891 bln
-2.49 bln
-1.75%
jan 1, 2012
187.076 bln
+47.185 bln
33.73%
jan 1, 2013
161.377 bln
-25.699 bln
-13.74%
jan 1, 2014
154.662 bln
-6.715 bln
-4.16%
jan 1, 2015
162.186 bln
+7.525 bln
4.87%
jan 1, 2016
154.503 bln
-7.683 bln
-4.74%
Ranking of countries by current statistics by years


Comments: