29
/
en
AIzaSyAYiBZKx7MnpbEhh9jyipgxe19OcubqV5w
April 1, 2024
269375
Turkey
TUR
true
2
1
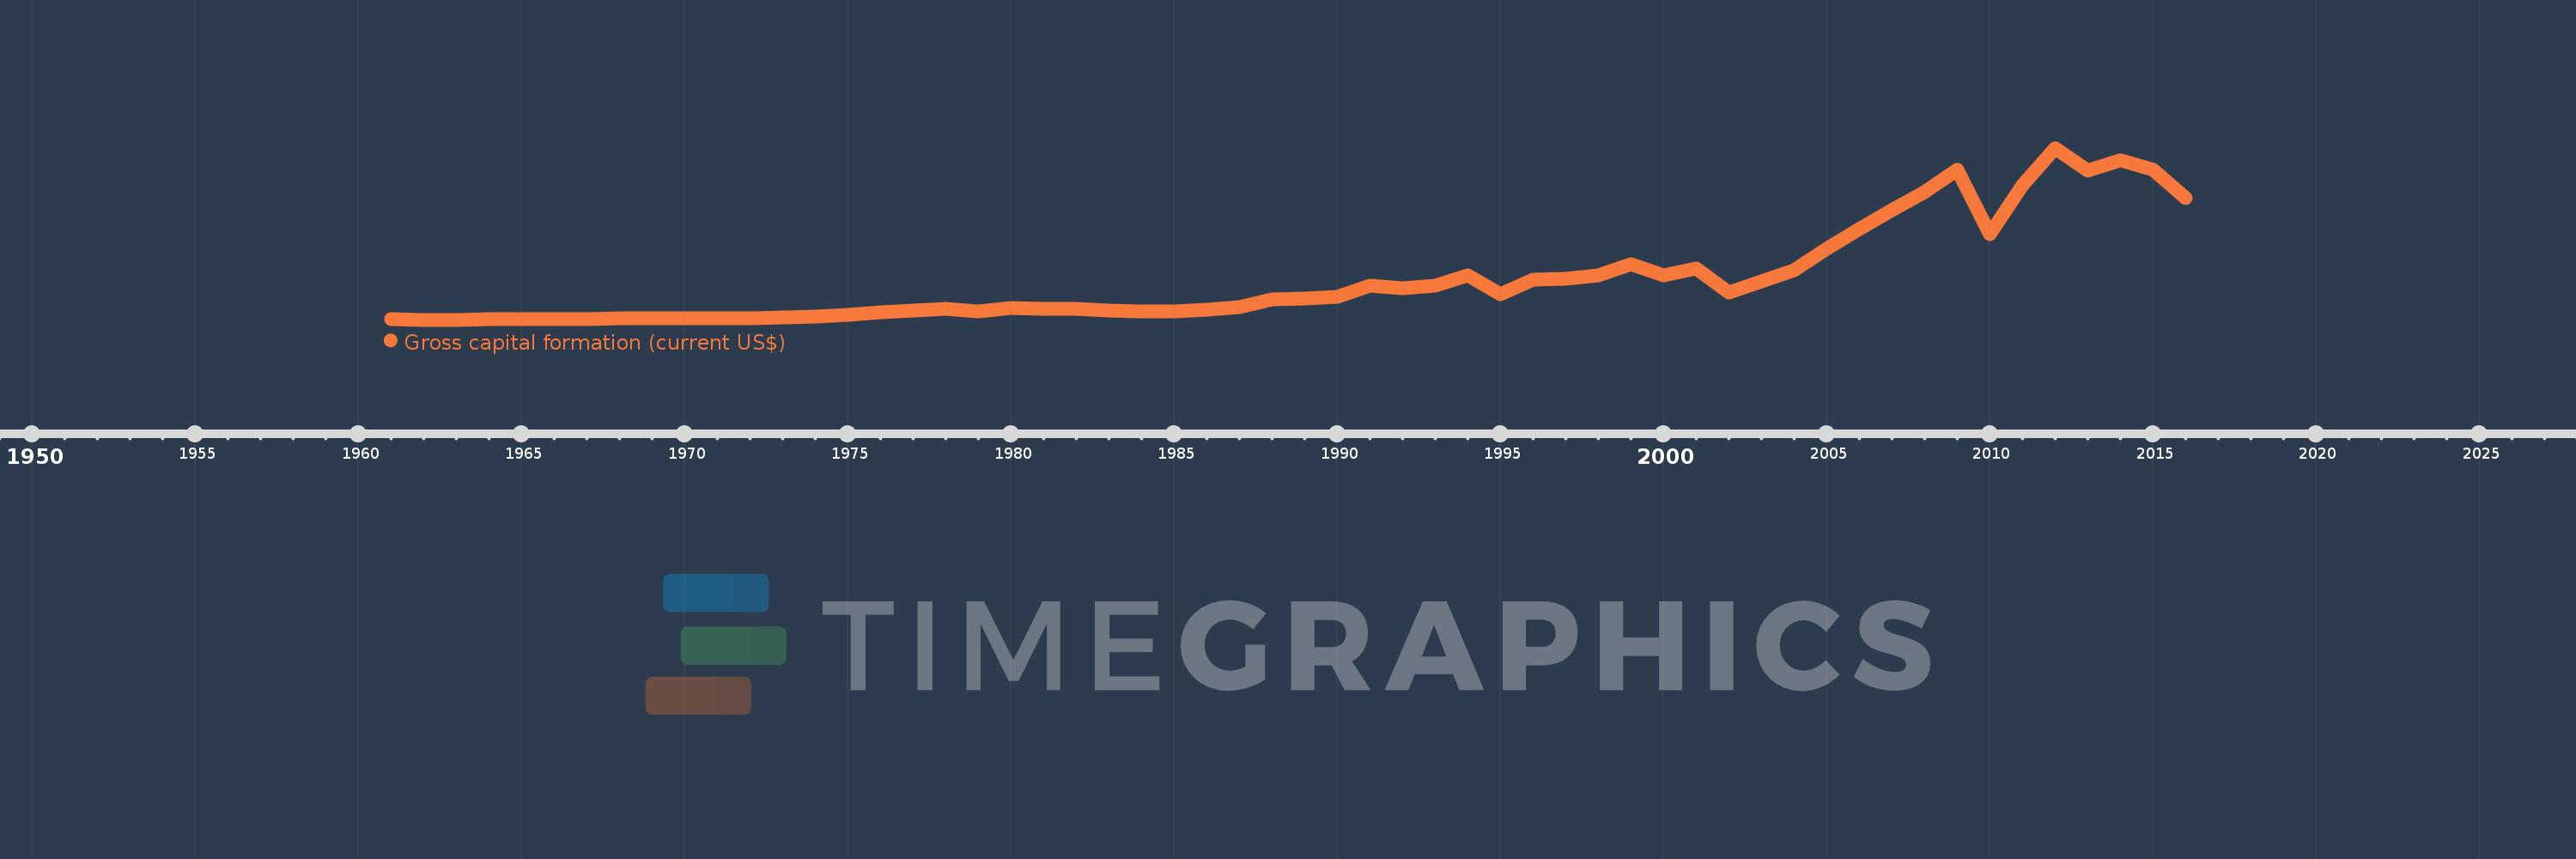
Gross capital formation (current US$)
2016,2015,2014,2013,2012,2011,2010,2009,2008,2007,2006,2005,2004,2003,2002,2001,2000,1999,1998,1997,1996,1995,1994,1993,1992,1991,1990,1989,1988,1987,1986,1985,1984,1983,1982,1981,1980,1979,1978,1977,1976,1975,1974,1973,1972,1971,1970,1969,1968,1967,1966,1965,1964,1963,1962,1961
This statistics in other country:
AfghanistanAlbaniaAlgeriaAngolaAntigua and BarbudaArab WorldArgentinaArmeniaArubaAustraliaAustriaAzerbaijanBahamas, TheBahrainBangladeshBarbadosBelarusBelgiumBelizeBeninBermudaBhutanBoliviaBosnia and HerzegovinaBotswanaBrazilBrunei DarussalamBulgariaBurkina FasoBurundiCabo VerdeCambodiaCameroonCanadaCaribbean small statesCentral African RepublicCentral Europe and the BalticsChadChileChinaColombiaComorosCongo, Dem. Rep.Congo, Rep.Costa RicaCote d'IvoireCroatiaCubaCyprusCzech RepublicDenmarkDjiboutiDominicaDominican RepublicEarly-demographic dividendEast Asia & PacificEast Asia & Pacific (excluding high income)East Asia & Pacific (IDA & IBRD countries)EcuadorEgypt, Arab Rep.El SalvadorEquatorial GuineaEritreaEstoniaEthiopiaEuro areaEurope & Central AsiaEurope & Central Asia (excluding high income)Europe & Central Asia (IDA & IBRD countries)European UnionFaroe IslandsFijiFinlandFragile and conflict affected situationsFranceGabonGambia, TheGeorgiaGermanyGhanaGreeceGrenadaGuatemalaGuineaGuinea-BissauGuyanaHaitiHeavily indebted poor countries (HIPC)High incomeHondurasHong Kong SAR, ChinaHungaryIBRD onlyIcelandIDA & IBRD totalIDA blendIDA onlyIDA totalIndiaIndonesiaIran, Islamic Rep.IraqIrelandIsraelItalyJamaicaJapanJordanKazakhstanKenyaKiribatiKorea, Rep.KosovoKuwaitKyrgyz RepublicLao PDRLate-demographic dividendLatin America & Caribbean Latin America & Caribbean (excluding high income)Latin America & the Caribbean (IDA & IBRD countries)LatviaLeast developed countries: UN classificationLebanonLesothoLiberiaLibyaLithuaniaLow & middle incomeLow incomeLower middle incomeLuxembourgMacao SAR, ChinaMacedonia, FYRMadagascarMalawiMalaysiaMaldivesMaliMaltaMauritaniaMauritiusMexicoMicronesia, Fed. Sts.Middle East & North AfricaMiddle East & North Africa (excluding high income)Middle East & North Africa (IDA & IBRD countries)Middle incomeMoldovaMongoliaMontenegroMoroccoMozambiqueNamibiaNepalNetherlandsNew CaledoniaNew ZealandNicaraguaNigerNigeriaNorth AmericaNorwayOECD membersOmanOther small statesPakistanPanamaPapua New GuineaParaguayPeruPhilippinesPolandPortugalPost-demographic dividendPre-demographic dividendPuerto RicoQatarRomaniaRussian FederationRwandaSaudi ArabiaSenegalSerbiaSeychellesSierra LeoneSingaporeSlovak RepublicSloveniaSmall statesSolomon IslandsSouth AfricaSouth AsiaSouth Asia (IDA & IBRD)South SudanSpainSri LankaSt. Kitts and NevisSt. LuciaSt. Vincent and the GrenadinesSub-Saharan Africa Sub-Saharan Africa (excluding high income)Sub-Saharan Africa (IDA & IBRD countries)SudanSurinameSwazilandSwedenSwitzerlandSyrian Arab RepublicTajikistanTanzaniaThailandTimor-LesteTogoTongaTrinidad and TobagoTunisiaTurkeyTurkmenistanUgandaUkraineUnited Arab EmiratesUnited KingdomUnited StatesUpper middle incomeUruguayUzbekistanVanuatuVenezuela, RBVietnamWest Bank and GazaWorldYemen, Rep.ZambiaZimbabwe Timeline:
This timeline shows a graph from 1961 to 2016 of Turkey. No data until 1960. Number of actual observations by date: 56.
Source name:
World Development Indicators
Source organization:
World Bank national accounts data, and OECD National Accounts data files.
Categories, topics:
Economy & Growth
Last updated:
apr 23, 2017
Indicators value changes by year
Minimum:
800.0 mln
jan 1, 1962
Maximum:
182.507 bln
jan 1, 2012
At the date of observation
Value
Absolute change
Change from previous value
jan 1, 1961
1.397 bln
+1.397 bln
0.0%
jan 1, 1962
800.0 mln
-597.452 mln
-42.75%
jan 1, 1963
955.556 mln
+155.556 mln
19.44%
jan 1, 1964
1.211 bln
+255.556 mln
26.74%
jan 1, 1965
1.222 bln
+11.111 mln
0.92%
jan 1, 1966
1.356 bln
+133.333 mln
10.91%
jan 1, 1967
1.811 bln
+455.556 mln
33.61%
jan 1, 1968
1.978 bln
+166.667 mln
9.2%
jan 1, 1969
2.344 bln
+366.667 mln
18.54%
jan 1, 1970
2.6 bln
+255.556 mln
10.9%
jan 1, 1971
2.513 bln
-86.957 mln
-3.34%
jan 1, 1972
2.239 bln
-273.987 mln
-10.9%
jan 1, 1973
3.435 bln
+1.196 bln
53.4%
jan 1, 1974
3.979 bln
+544.17 mln
15.84%
jan 1, 1975
6.369 bln
+2.39 bln
60.07%
jan 1, 1976
8.351 bln
+1.982 bln
31.12%
jan 1, 1977
10.422 bln
+2.071 bln
24.8%
jan 1, 1978
12.126 bln
+1.705 bln
16.36%
jan 1, 1979
9.867 bln
-2.259 bln
-18.63%
jan 1, 1980
12.965 bln
+3.097 bln
31.39%
jan 1, 1981
12.495 bln
-469.504 mln
-3.62%
jan 1, 1982
12.695 bln
+199.705 mln
1.6%
jan 1, 1983
10.942 bln
-1.752 bln
-13.8%
jan 1, 1984
10.044 bln
-897.79 mln
-8.2%
jan 1, 1985
9.707 bln
-337.931 mln
-3.36%
jan 1, 1986
11.103 bln
+1.396 bln
14.38%
jan 1, 1987
14.273 bln
+3.17 bln
28.55%
jan 1, 1988
22.374 bln
+8.101 bln
56.76%
jan 1, 1989
22.843 bln
+468.552 mln
2.09%
jan 1, 1990
25.149 bln
+2.307 bln
10.1%
jan 1, 1991
36.99 bln
+11.841 bln
47.08%
jan 1, 1992
34.074 bln
-2.916 bln
-7.88%
jan 1, 1993
37.02 bln
+2.945 bln
8.64%
jan 1, 1994
47.953 bln
+10.934 bln
29.53%
jan 1, 1995
27.864 bln
-20.089 bln
-41.89%
jan 1, 1996
43.174 bln
+15.31 bln
54.95%
jan 1, 1997
44.555 bln
+1.381 bln
3.2%
jan 1, 1998
47.669 bln
+3.114 bln
6.99%
jan 1, 1999
59.549 bln
+11.88 bln
24.92%
jan 1, 2000
47.762 bln
-11.787 bln
-19.79%
jan 1, 2001
55.358 bln
+7.596 bln
15.9%
jan 1, 2002
29.566 bln
-25.792 bln
-46.59%
jan 1, 2003
40.959 bln
+11.393 bln
38.54%
jan 1, 2004
53.319 bln
+12.36 bln
30.18%
jan 1, 2005
76.041 bln
+22.722 bln
42.62%
jan 1, 2006
96.546 bln
+20.504 bln
26.96%
jan 1, 2007
117.089 bln
+20.544 bln
21.28%
jan 1, 2008
136.337 bln
+19.247 bln
16.44%
jan 1, 2009
159.078 bln
+22.742 bln
16.68%
jan 1, 2010
91.803 bln
-67.275 bln
-42.29%
jan 1, 2011
142.744 bln
+50.942 bln
55.49%
jan 1, 2012
182.507 bln
+39.763 bln
27.86%
jan 1, 2013
158.818 bln
-23.69 bln
-12.98%
jan 1, 2014
169.941 bln
+11.123 bln
7.0%
jan 1, 2015
159.846 bln
-10.095 bln
-5.94%
jan 1, 2016
129.991 bln
-29.855 bln
-18.68%
Ranking of countries by current statistics by years


Comments: