29
/
en
AIzaSyAYiBZKx7MnpbEhh9jyipgxe19OcubqV5w
April 1, 2024
264649
Togo
TGO
true
2
1
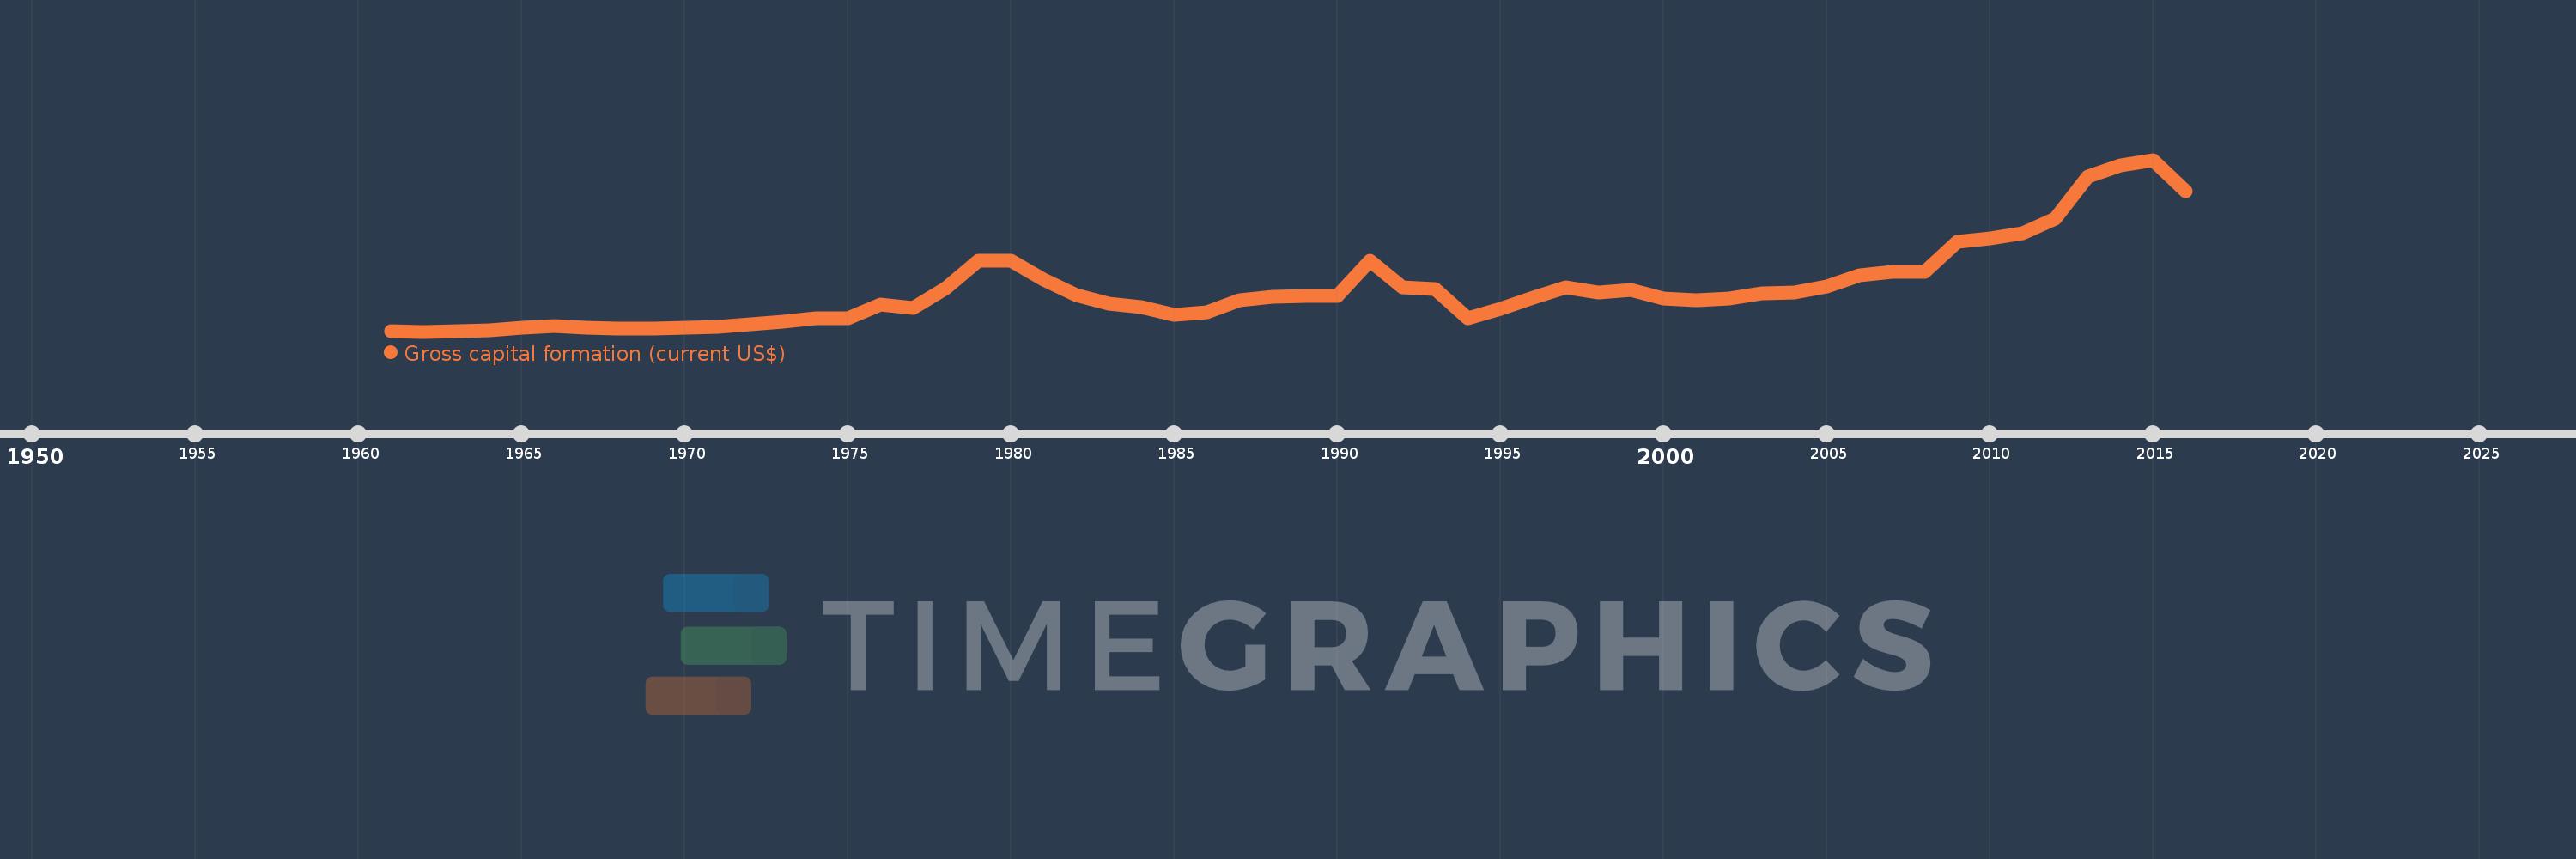
Gross capital formation (current US$)
2016,2015,2014,2013,2012,2011,2010,2009,2008,2007,2006,2005,2004,2003,2002,2001,2000,1999,1998,1997,1996,1995,1994,1993,1992,1991,1990,1989,1988,1987,1986,1985,1984,1983,1982,1981,1980,1979,1978,1977,1976,1975,1974,1973,1972,1971,1970,1969,1968,1967,1966,1965,1964,1963,1962,1961
This statistics in other country:
AfghanistanAlbaniaAlgeriaAngolaAntigua and BarbudaArab WorldArgentinaArmeniaArubaAustraliaAustriaAzerbaijanBahamas, TheBahrainBangladeshBarbadosBelarusBelgiumBelizeBeninBermudaBhutanBoliviaBosnia and HerzegovinaBotswanaBrazilBrunei DarussalamBulgariaBurkina FasoBurundiCabo VerdeCambodiaCameroonCanadaCaribbean small statesCentral African RepublicCentral Europe and the BalticsChadChileChinaColombiaComorosCongo, Dem. Rep.Congo, Rep.Costa RicaCote d'IvoireCroatiaCubaCyprusCzech RepublicDenmarkDjiboutiDominicaDominican RepublicEarly-demographic dividendEast Asia & PacificEast Asia & Pacific (excluding high income)East Asia & Pacific (IDA & IBRD countries)EcuadorEgypt, Arab Rep.El SalvadorEquatorial GuineaEritreaEstoniaEthiopiaEuro areaEurope & Central AsiaEurope & Central Asia (excluding high income)Europe & Central Asia (IDA & IBRD countries)European UnionFaroe IslandsFijiFinlandFragile and conflict affected situationsFranceGabonGambia, TheGeorgiaGermanyGhanaGreeceGrenadaGuatemalaGuineaGuinea-BissauGuyanaHaitiHeavily indebted poor countries (HIPC)High incomeHondurasHong Kong SAR, ChinaHungaryIBRD onlyIcelandIDA & IBRD totalIDA blendIDA onlyIDA totalIndiaIndonesiaIran, Islamic Rep.IraqIrelandIsraelItalyJamaicaJapanJordanKazakhstanKenyaKiribatiKorea, Rep.KosovoKuwaitKyrgyz RepublicLao PDRLate-demographic dividendLatin America & Caribbean Latin America & Caribbean (excluding high income)Latin America & the Caribbean (IDA & IBRD countries)LatviaLeast developed countries: UN classificationLebanonLesothoLiberiaLibyaLithuaniaLow & middle incomeLow incomeLower middle incomeLuxembourgMacao SAR, ChinaMacedonia, FYRMadagascarMalawiMalaysiaMaldivesMaliMaltaMauritaniaMauritiusMexicoMicronesia, Fed. Sts.Middle East & North AfricaMiddle East & North Africa (excluding high income)Middle East & North Africa (IDA & IBRD countries)Middle incomeMoldovaMongoliaMontenegroMoroccoMozambiqueNamibiaNepalNetherlandsNew CaledoniaNew ZealandNicaraguaNigerNigeriaNorth AmericaNorwayOECD membersOmanOther small statesPakistanPanamaPapua New GuineaParaguayPeruPhilippinesPolandPortugalPost-demographic dividendPre-demographic dividendPuerto RicoQatarRomaniaRussian FederationRwandaSaudi ArabiaSenegalSerbiaSeychellesSierra LeoneSingaporeSlovak RepublicSloveniaSmall statesSolomon IslandsSouth AfricaSouth AsiaSouth Asia (IDA & IBRD)South SudanSpainSri LankaSt. Kitts and NevisSt. LuciaSt. Vincent and the GrenadinesSub-Saharan Africa Sub-Saharan Africa (excluding high income)Sub-Saharan Africa (IDA & IBRD countries)SudanSurinameSwazilandSwedenSwitzerlandSyrian Arab RepublicTajikistanTanzaniaThailandTimor-LesteTogoTongaTrinidad and TobagoTunisiaTurkeyTurkmenistanUgandaUkraineUnited Arab EmiratesUnited KingdomUnited StatesUpper middle incomeUruguayUzbekistanVanuatuVenezuela, RBVietnamWest Bank and GazaWorldYemen, Rep.ZambiaZimbabwe Timeline:
This timeline shows a graph from 1961 to 2016 of Togo. No data until 1960. Number of actual observations by date: 56.
Source name:
World Development Indicators
Source organization:
World Bank national accounts data, and OECD National Accounts data files.
Categories, topics:
Economy & Growth
Last updated:
apr 23, 2017
Indicators value changes by year
Minimum:
10.193 mln
jan 1, 1962
Maximum:
1.037 bln
jan 1, 2015
At the date of observation
Value
Absolute change
Change from previous value
jan 1, 1961
13.051 mln
+13.051 mln
0.0%
jan 1, 1962
10.193 mln
-2.858 mln
-21.9%
jan 1, 1963
13.469 mln
+3.275 mln
32.13%
jan 1, 1964
18.366 mln
+4.898 mln
36.36%
jan 1, 1965
33.466 mln
+15.1 mln
82.21%
jan 1, 1966
42.03 mln
+8.565 mln
25.59%
jan 1, 1967
35.412 mln
-6.618 mln
-15.75%
jan 1, 1968
29.268 mln
-6.144 mln
-17.35%
jan 1, 1969
26.66 mln
-2.608 mln
-8.91%
jan 1, 1970
35.39 mln
+8.73 mln
32.75%
jan 1, 1971
38.35 mln
+2.96 mln
8.36%
jan 1, 1972
54.112 mln
+15.762 mln
41.1%
jan 1, 1973
69.437 mln
+15.325 mln
28.32%
jan 1, 1974
88.385 mln
+18.948 mln
27.29%
jan 1, 1975
91.814 mln
+3.429 mln
3.88%
jan 1, 1976
170.778 mln
+78.965 mln
86.01%
jan 1, 1977
154.007 mln
-16.772 mln
-9.82%
jan 1, 1978
267.014 mln
+113.008 mln
73.38%
jan 1, 1979
434.289 mln
+167.275 mln
62.65%
jan 1, 1980
435.31 mln
+1.02 mln
0.23%
jan 1, 1981
323.268 mln
-112.042 mln
-25.74%
jan 1, 1982
229.27 mln
-93.998 mln
-29.08%
jan 1, 1983
175.286 mln
-53.985 mln
-23.55%
jan 1, 1984
157.715 mln
-17.57 mln
-10.02%
jan 1, 1985
108.02 mln
-49.696 mln
-31.51%
jan 1, 1986
126.808 mln
+18.788 mln
17.39%
jan 1, 1987
199.766 mln
+72.958 mln
57.53%
jan 1, 1988
220.339 mln
+20.574 mln
10.3%
jan 1, 1989
220.992 mln
+652.285K
0.3%
jan 1, 1990
223.505 mln
+2.514 mln
1.14%
jan 1, 1991
432.689 mln
+209.184 mln
93.59%
jan 1, 1992
274.214 mln
-158.475 mln
-36.63%
jan 1, 1993
265.987 mln
-8.226 mln
-3.0%
jan 1, 1994
92.24 mln
-173.747 mln
-65.32%
jan 1, 1995
147.821 mln
+55.581 mln
60.26%
jan 1, 1996
211.201 mln
+63.379 mln
42.88%
jan 1, 1997
275.045 mln
+63.845 mln
30.23%
jan 1, 1998
244.141 mln
-30.904 mln
-11.24%
jan 1, 1999
260.917 mln
+16.776 mln
6.87%
jan 1, 2000
210.249 mln
-50.668 mln
-19.42%
jan 1, 2001
196.467 mln
-13.782 mln
-6.55%
jan 1, 2002
208.016 mln
+11.548 mln
5.88%
jan 1, 2003
237.698 mln
+29.683 mln
14.27%
jan 1, 2004
241.486 mln
+3.788 mln
1.59%
jan 1, 2005
281.158 mln
+39.671 mln
16.43%
jan 1, 2006
344.601 mln
+63.444 mln
22.57%
jan 1, 2007
369.52 mln
+24.919 mln
7.23%
jan 1, 2008
369.498 mln
-21.865K
-0.01%
jan 1, 2009
547.947 mln
+178.449 mln
48.29%
jan 1, 2010
568.863 mln
+20.915 mln
3.82%
jan 1, 2011
600.665 mln
+31.802 mln
5.59%
jan 1, 2012
685.819 mln
+85.154 mln
14.18%
jan 1, 2013
935.421 mln
+249.602 mln
36.39%
jan 1, 2014
1.002 bln
+66.862 mln
7.15%
jan 1, 2015
1.037 bln
+35.17 mln
3.51%
jan 1, 2016
847.611 mln
-189.842 mln
-18.3%
Ranking of countries by current statistics by years


Comments: