29
/
en
AIzaSyAYiBZKx7MnpbEhh9jyipgxe19OcubqV5w
April 1, 2024
146883
Guinea-Bissau
GNB
true
2
1
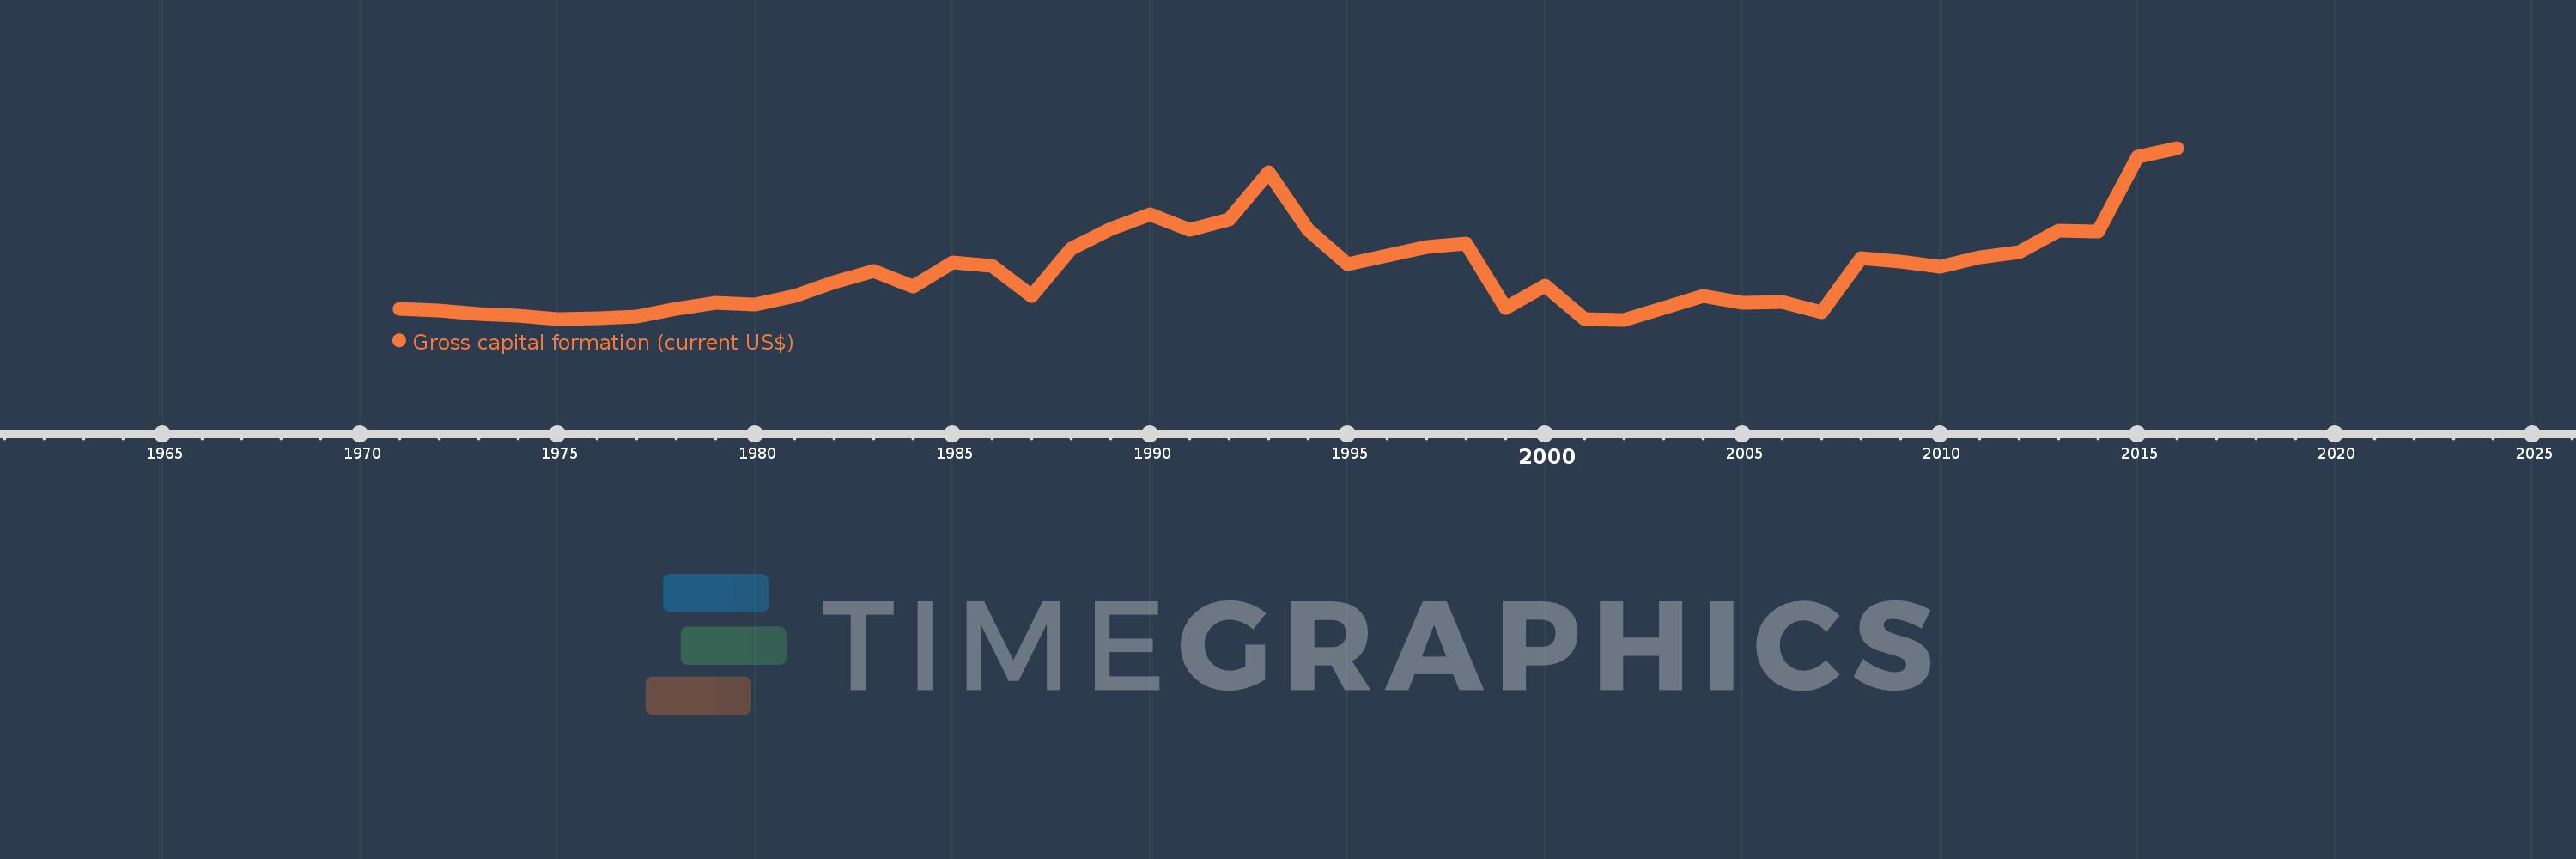
Gross capital formation (current US$)
2016,2015,2014,2013,2012,2011,2010,2009,2008,2007,2006,2005,2004,2003,2002,2001,2000,1999,1998,1997,1996,1995,1994,1993,1992,1991,1990,1989,1988,1987,1986,1985,1984,1983,1982,1981,1980,1979,1978,1977,1976,1975,1974,1973,1972,1971
This statistics in other country:
AfghanistanAlbaniaAlgeriaAngolaAntigua and BarbudaArab WorldArgentinaArmeniaArubaAustraliaAustriaAzerbaijanBahamas, TheBahrainBangladeshBarbadosBelarusBelgiumBelizeBeninBermudaBhutanBoliviaBosnia and HerzegovinaBotswanaBrazilBrunei DarussalamBulgariaBurkina FasoBurundiCabo VerdeCambodiaCameroonCanadaCaribbean small statesCentral African RepublicCentral Europe and the BalticsChadChileChinaColombiaComorosCongo, Dem. Rep.Congo, Rep.Costa RicaCote d'IvoireCroatiaCubaCyprusCzech RepublicDenmarkDjiboutiDominicaDominican RepublicEarly-demographic dividendEast Asia & PacificEast Asia & Pacific (excluding high income)East Asia & Pacific (IDA & IBRD countries)EcuadorEgypt, Arab Rep.El SalvadorEquatorial GuineaEritreaEstoniaEthiopiaEuro areaEurope & Central AsiaEurope & Central Asia (excluding high income)Europe & Central Asia (IDA & IBRD countries)European UnionFaroe IslandsFijiFinlandFragile and conflict affected situationsFranceGabonGambia, TheGeorgiaGermanyGhanaGreeceGrenadaGuatemalaGuineaGuinea-BissauGuyanaHaitiHeavily indebted poor countries (HIPC)High incomeHondurasHong Kong SAR, ChinaHungaryIBRD onlyIcelandIDA & IBRD totalIDA blendIDA onlyIDA totalIndiaIndonesiaIran, Islamic Rep.IraqIrelandIsraelItalyJamaicaJapanJordanKazakhstanKenyaKiribatiKorea, Rep.KosovoKuwaitKyrgyz RepublicLao PDRLate-demographic dividendLatin America & Caribbean Latin America & Caribbean (excluding high income)Latin America & the Caribbean (IDA & IBRD countries)LatviaLeast developed countries: UN classificationLebanonLesothoLiberiaLibyaLithuaniaLow & middle incomeLow incomeLower middle incomeLuxembourgMacao SAR, ChinaMacedonia, FYRMadagascarMalawiMalaysiaMaldivesMaliMaltaMauritaniaMauritiusMexicoMicronesia, Fed. Sts.Middle East & North AfricaMiddle East & North Africa (excluding high income)Middle East & North Africa (IDA & IBRD countries)Middle incomeMoldovaMongoliaMontenegroMoroccoMozambiqueNamibiaNepalNetherlandsNew CaledoniaNew ZealandNicaraguaNigerNigeriaNorth AmericaNorwayOECD membersOmanOther small statesPakistanPanamaPapua New GuineaParaguayPeruPhilippinesPolandPortugalPost-demographic dividendPre-demographic dividendPuerto RicoQatarRomaniaRussian FederationRwandaSaudi ArabiaSenegalSerbiaSeychellesSierra LeoneSingaporeSlovak RepublicSloveniaSmall statesSolomon IslandsSouth AfricaSouth AsiaSouth Asia (IDA & IBRD)South SudanSpainSri LankaSt. Kitts and NevisSt. LuciaSt. Vincent and the GrenadinesSub-Saharan Africa Sub-Saharan Africa (excluding high income)Sub-Saharan Africa (IDA & IBRD countries)SudanSurinameSwazilandSwedenSwitzerlandSyrian Arab RepublicTajikistanTanzaniaThailandTimor-LesteTogoTongaTrinidad and TobagoTunisiaTurkeyTurkmenistanUgandaUkraineUnited Arab EmiratesUnited KingdomUnited StatesUpper middle incomeUruguayUzbekistanVanuatuVenezuela, RBVietnamWest Bank and GazaWorldYemen, Rep.ZambiaZimbabwe Timeline:
This timeline shows a graph from 1971 to 2016 of Guinea-Bissau. No data until 1970. Number of actual observations by date: 46.
Source name:
World Development Indicators
Source organization:
World Bank national accounts data, and OECD National Accounts data files.
Categories, topics:
Economy & Growth
Last updated:
apr 23, 2017
Indicators value changes by year
Minimum:
16.087 mln
jan 1, 2002
Maximum:
125.168 mln
jan 1, 2016
At the date of observation
Value
Absolute change
Change from previous value
jan 1, 1971
23.284 mln
+23.284 mln
0.0%
jan 1, 1972
21.991 mln
-1.292 mln
-5.55%
jan 1, 1973
19.954 mln
-2.037 mln
-9.26%
jan 1, 1974
18.67 mln
-1.284 mln
-6.44%
jan 1, 1975
16.609 mln
-2.061 mln
-11.04%
jan 1, 1976
16.781 mln
+171.644K
1.03%
jan 1, 1977
18.273 mln
+1.492 mln
8.89%
jan 1, 1978
22.742 mln
+4.469 mln
24.46%
jan 1, 1979
26.613 mln
+3.871 mln
17.02%
jan 1, 1980
25.885 mln
-727.494K
-2.73%
jan 1, 1981
31.183 mln
+5.298 mln
20.47%
jan 1, 1982
39.837 mln
+8.654 mln
27.75%
jan 1, 1983
46.776 mln
+6.939 mln
17.42%
jan 1, 1984
37.07 mln
-9.706 mln
-20.75%
jan 1, 1985
52.241 mln
+15.171 mln
40.92%
jan 1, 1986
50.494 mln
-1.747 mln
-3.34%
jan 1, 1987
30.967 mln
-19.527 mln
-38.67%
jan 1, 1988
61.216 mln
+30.248 mln
97.68%
jan 1, 1989
73.515 mln
+12.299 mln
20.09%
jan 1, 1990
83.087 mln
+9.572 mln
13.02%
jan 1, 1991
73.008 mln
-10.08 mln
-12.13%
jan 1, 1992
79.689 mln
+6.682 mln
9.15%
jan 1, 1993
109.528 mln
+29.839 mln
37.44%
jan 1, 1994
73.095 mln
-36.433 mln
-33.26%
jan 1, 1995
51.296 mln
-21.799 mln
-29.82%
jan 1, 1996
56.637 mln
+5.341 mln
10.41%
jan 1, 1997
62.337 mln
+5.7 mln
10.06%
jan 1, 1998
64.45 mln
+2.113 mln
3.39%
jan 1, 1999
23.402 mln
-41.048 mln
-63.69%
jan 1, 2000
37.707 mln
+14.305 mln
61.13%
jan 1, 2001
16.551 mln
-21.156 mln
-56.11%
jan 1, 2002
16.087 mln
-464.098K
-2.8%
jan 1, 2003
23.317 mln
+7.23 mln
44.94%
jan 1, 2004
30.942 mln
+7.625 mln
32.7%
jan 1, 2005
27.077 mln
-3.865 mln
-12.49%
jan 1, 2006
27.187 mln
+110.086K
0.41%
jan 1, 2007
21.032 mln
-6.154 mln
-22.64%
jan 1, 2008
54.94 mln
+33.908 mln
161.22%
jan 1, 2009
52.766 mln
-2.174 mln
-3.96%
jan 1, 2010
49.896 mln
-2.871 mln
-5.44%
jan 1, 2011
55.763 mln
+5.867 mln
11.76%
jan 1, 2012
58.937 mln
+3.174 mln
5.69%
jan 1, 2013
72.708 mln
+13.771 mln
23.37%
jan 1, 2014
72.004 mln
-704.416K
-0.97%
jan 1, 2015
119.498 mln
+47.494 mln
65.96%
jan 1, 2016
125.168 mln
+5.67 mln
4.75%
Ranking of countries by current statistics by years


Comments: