29
/
en
AIzaSyAYiBZKx7MnpbEhh9jyipgxe19OcubqV5w
April 1, 2024
272289
Uganda
UGA
true
2
1
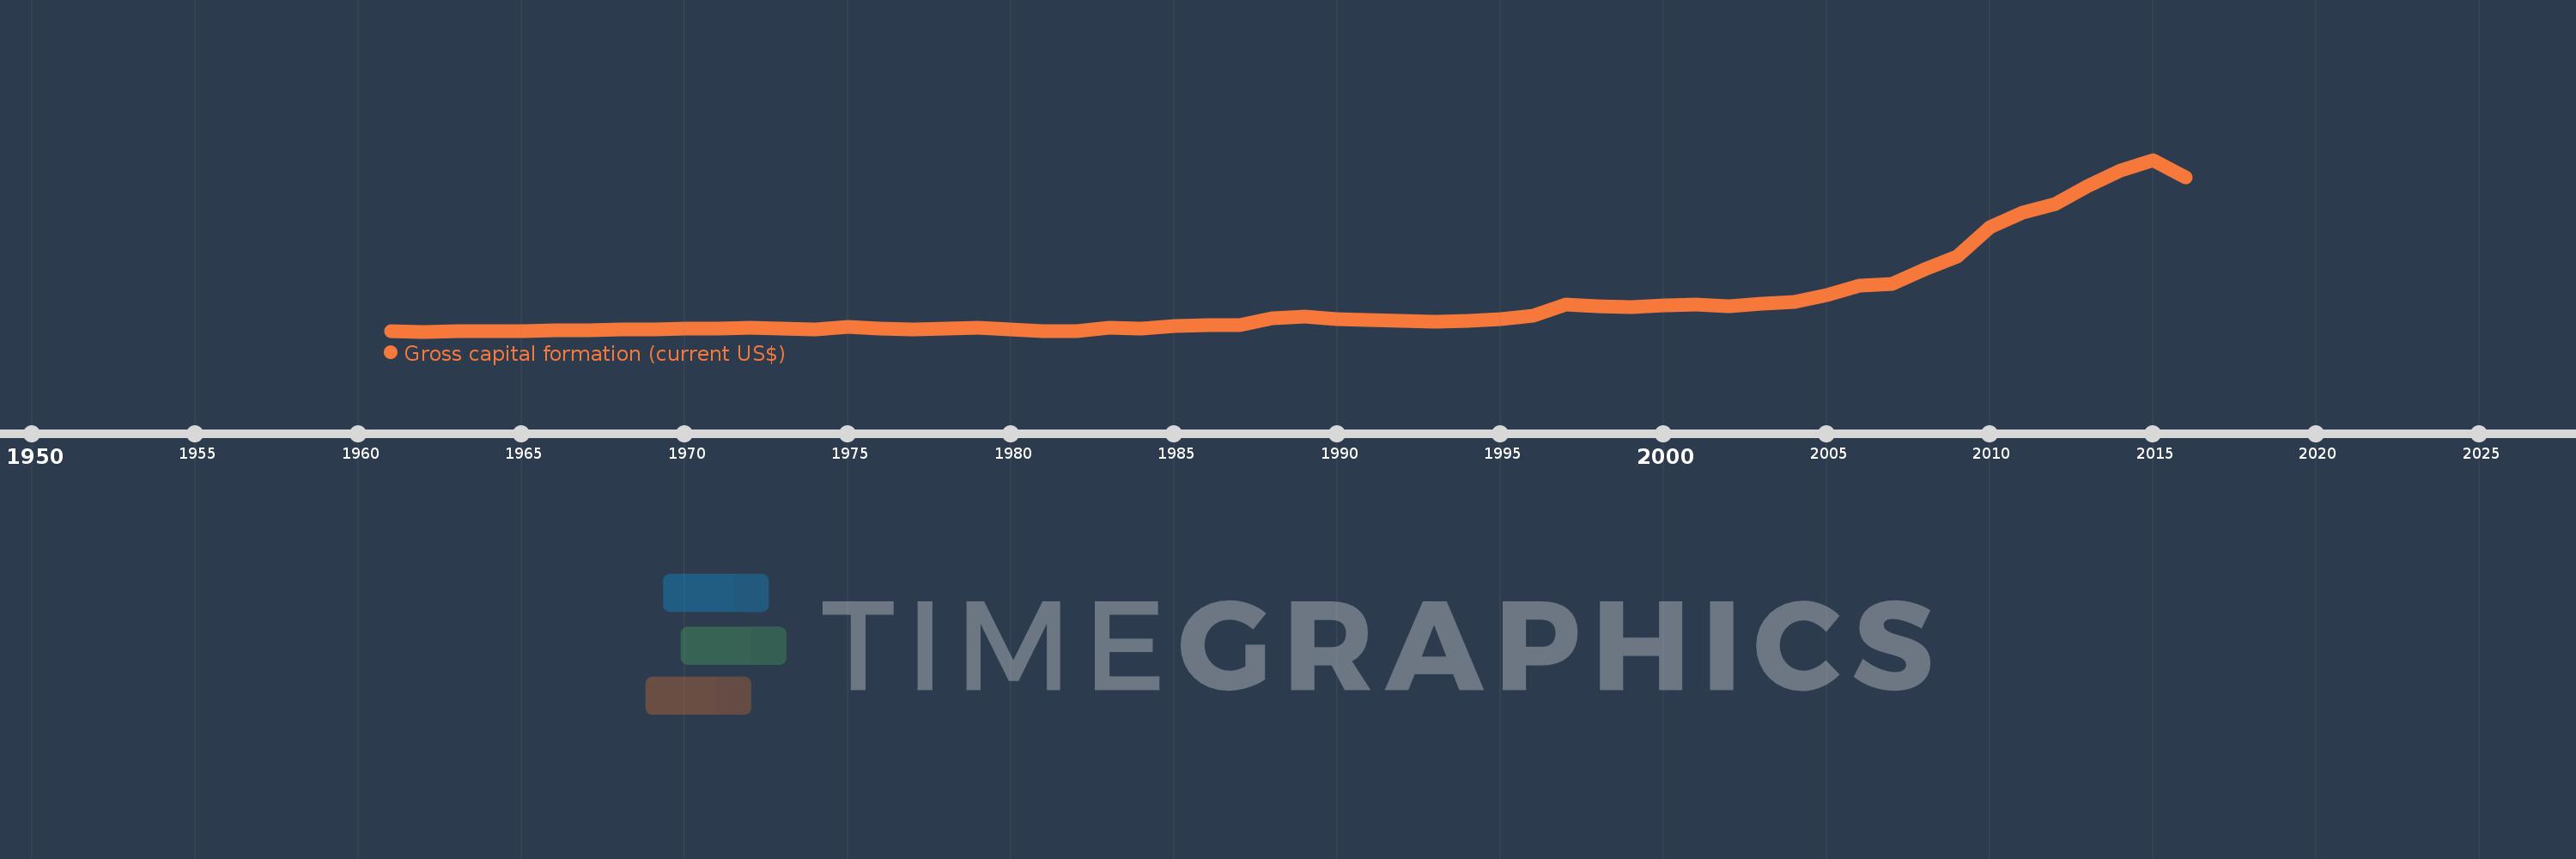
Gross capital formation (current US$)
2016,2015,2014,2013,2012,2011,2010,2009,2008,2007,2006,2005,2004,2003,2002,2001,2000,1999,1998,1997,1996,1995,1994,1993,1992,1991,1990,1989,1988,1987,1986,1985,1984,1983,1982,1981,1980,1979,1978,1977,1976,1975,1974,1973,1972,1971,1970,1969,1968,1967,1966,1965,1964,1963,1962,1961
This statistics in other country:
AfghanistanAlbaniaAlgeriaAngolaAntigua and BarbudaArab WorldArgentinaArmeniaArubaAustraliaAustriaAzerbaijanBahamas, TheBahrainBangladeshBarbadosBelarusBelgiumBelizeBeninBermudaBhutanBoliviaBosnia and HerzegovinaBotswanaBrazilBrunei DarussalamBulgariaBurkina FasoBurundiCabo VerdeCambodiaCameroonCanadaCaribbean small statesCentral African RepublicCentral Europe and the BalticsChadChileChinaColombiaComorosCongo, Dem. Rep.Congo, Rep.Costa RicaCote d'IvoireCroatiaCubaCyprusCzech RepublicDenmarkDjiboutiDominicaDominican RepublicEarly-demographic dividendEast Asia & PacificEast Asia & Pacific (excluding high income)East Asia & Pacific (IDA & IBRD countries)EcuadorEgypt, Arab Rep.El SalvadorEquatorial GuineaEritreaEstoniaEthiopiaEuro areaEurope & Central AsiaEurope & Central Asia (excluding high income)Europe & Central Asia (IDA & IBRD countries)European UnionFaroe IslandsFijiFinlandFragile and conflict affected situationsFranceGabonGambia, TheGeorgiaGermanyGhanaGreeceGrenadaGuatemalaGuineaGuinea-BissauGuyanaHaitiHeavily indebted poor countries (HIPC)High incomeHondurasHong Kong SAR, ChinaHungaryIBRD onlyIcelandIDA & IBRD totalIDA blendIDA onlyIDA totalIndiaIndonesiaIran, Islamic Rep.IraqIrelandIsraelItalyJamaicaJapanJordanKazakhstanKenyaKiribatiKorea, Rep.KosovoKuwaitKyrgyz RepublicLao PDRLate-demographic dividendLatin America & Caribbean Latin America & Caribbean (excluding high income)Latin America & the Caribbean (IDA & IBRD countries)LatviaLeast developed countries: UN classificationLebanonLesothoLiberiaLibyaLithuaniaLow & middle incomeLow incomeLower middle incomeLuxembourgMacao SAR, ChinaMacedonia, FYRMadagascarMalawiMalaysiaMaldivesMaliMaltaMauritaniaMauritiusMexicoMicronesia, Fed. Sts.Middle East & North AfricaMiddle East & North Africa (excluding high income)Middle East & North Africa (IDA & IBRD countries)Middle incomeMoldovaMongoliaMontenegroMoroccoMozambiqueNamibiaNepalNetherlandsNew CaledoniaNew ZealandNicaraguaNigerNigeriaNorth AmericaNorwayOECD membersOmanOther small statesPakistanPanamaPapua New GuineaParaguayPeruPhilippinesPolandPortugalPost-demographic dividendPre-demographic dividendPuerto RicoQatarRomaniaRussian FederationRwandaSaudi ArabiaSenegalSerbiaSeychellesSierra LeoneSingaporeSlovak RepublicSloveniaSmall statesSolomon IslandsSouth AfricaSouth AsiaSouth Asia (IDA & IBRD)South SudanSpainSri LankaSt. Kitts and NevisSt. LuciaSt. Vincent and the GrenadinesSub-Saharan Africa Sub-Saharan Africa (excluding high income)Sub-Saharan Africa (IDA & IBRD countries)SudanSurinameSwazilandSwedenSwitzerlandSyrian Arab RepublicTajikistanTanzaniaThailandTimor-LesteTogoTongaTrinidad and TobagoTunisiaTurkeyTurkmenistanUgandaUkraineUnited Arab EmiratesUnited KingdomUnited StatesUpper middle incomeUruguayUzbekistanVanuatuVenezuela, RBVietnamWest Bank and GazaWorldYemen, Rep.ZambiaZimbabwe Timeline:
This timeline shows a graph from 1961 to 2016 of Uganda. No data until 1960. Number of actual observations by date: 56.
Source name:
World Development Indicators
Source organization:
World Bank national accounts data, and OECD National Accounts data files.
Categories, topics:
Economy & Growth
Last updated:
apr 23, 2017
Indicators value changes by year
Minimum:
44.949 mln
jan 1, 1962
Maximum:
7.447 bln
jan 1, 2015
At the date of observation
Value
Absolute change
Change from previous value
jan 1, 1961
46.379 mln
+46.379 mln
0.0%
jan 1, 1962
44.949 mln
-1.431 mln
-3.09%
jan 1, 1963
50.057 mln
+5.108 mln
11.36%
jan 1, 1964
66.095 mln
+16.039 mln
32.04%
jan 1, 1965
71.203 mln
+5.108 mln
7.73%
jan 1, 1966
99.44 mln
+28.236 mln
39.66%
jan 1, 1967
106.443 mln
+7.003 mln
7.04%
jan 1, 1968
130.252 mln
+23.81 mln
22.37%
jan 1, 1969
135.854 mln
+5.602 mln
4.3%
jan 1, 1970
163.866 mln
+28.011 mln
20.62%
jan 1, 1971
176.471 mln
+12.605 mln
7.69%
jan 1, 1972
228.291 mln
+51.821 mln
29.37%
jan 1, 1973
173.669 mln
-54.622 mln
-23.93%
jan 1, 1974
148.459 mln
-25.21 mln
-14.52%
jan 1, 1975
243.937 mln
+95.478 mln
64.31%
jan 1, 1976
190.0 mln
-53.937 mln
-22.11%
jan 1, 1977
153.0 mln
-37.0 mln
-19.47%
jan 1, 1978
177.647 mln
+24.647 mln
16.11%
jan 1, 1979
200.435 mln
+22.788 mln
12.83%
jan 1, 1980
140.75 mln
-59.685 mln
-29.78%
jan 1, 1981
76.6 mln
-64.15 mln
-45.58%
jan 1, 1982
75.0 mln
-1.6 mln
-2.09%
jan 1, 1983
198.0 mln
+123.0 mln
164.0%
jan 1, 1984
166.0 mln
-32.0 mln
-16.16%
jan 1, 1985
294.308 mln
+128.308 mln
77.29%
jan 1, 1986
307.338 mln
+13.03 mln
4.43%
jan 1, 1987
331.392 mln
+24.055 mln
7.83%
jan 1, 1988
609.285 mln
+277.892 mln
83.86%
jan 1, 1989
702.467 mln
+93.182 mln
15.29%
jan 1, 1990
587.601 mln
-114.866 mln
-16.35%
jan 1, 1991
546.834 mln
-40.767 mln
-6.94%
jan 1, 1992
503.948 mln
-42.886 mln
-7.84%
jan 1, 1993
455.448 mln
-48.5 mln
-9.62%
jan 1, 1994
490.981 mln
+35.533 mln
7.8%
jan 1, 1995
585.868 mln
+94.887 mln
19.33%
jan 1, 1996
714.414 mln
+128.546 mln
21.94%
jan 1, 1997
1.219 bln
+504.942 mln
70.68%
jan 1, 1998
1.14 bln
-79.681 mln
-6.53%
jan 1, 1999
1.083 bln
-56.66 mln
-4.97%
jan 1, 2000
1.173 bln
+89.652 mln
8.28%
jan 1, 2001
1.207 bln
+34.015 mln
2.9%
jan 1, 2002
1.127 bln
-79.344 mln
-6.58%
jan 1, 2003
1.249 bln
+121.809 mln
10.8%
jan 1, 2004
1.33 bln
+80.555 mln
6.45%
jan 1, 2005
1.6 bln
+269.94 mln
20.3%
jan 1, 2006
2.015 bln
+415.415 mln
25.97%
jan 1, 2007
2.101 bln
+85.852 mln
4.26%
jan 1, 2008
2.715 bln
+613.721 mln
29.21%
jan 1, 2009
3.272 bln
+557.183 mln
20.53%
jan 1, 2010
4.542 bln
+1.27 bln
38.81%
jan 1, 2011
5.159 bln
+617.099 mln
13.59%
jan 1, 2012
5.54 bln
+381.551 mln
7.4%
jan 1, 2013
6.315 bln
+774.449 mln
13.98%
jan 1, 2014
6.975 bln
+659.839 mln
10.45%
jan 1, 2015
7.447 bln
+472.256 mln
6.77%
jan 1, 2016
6.698 bln
-749.157 mln
-10.06%
Ranking of countries by current statistics by years


Comments: