29
/
en
AIzaSyAYiBZKx7MnpbEhh9jyipgxe19OcubqV5w
April 1, 2024
239334
Sierra Leone
SLE
true
2
1
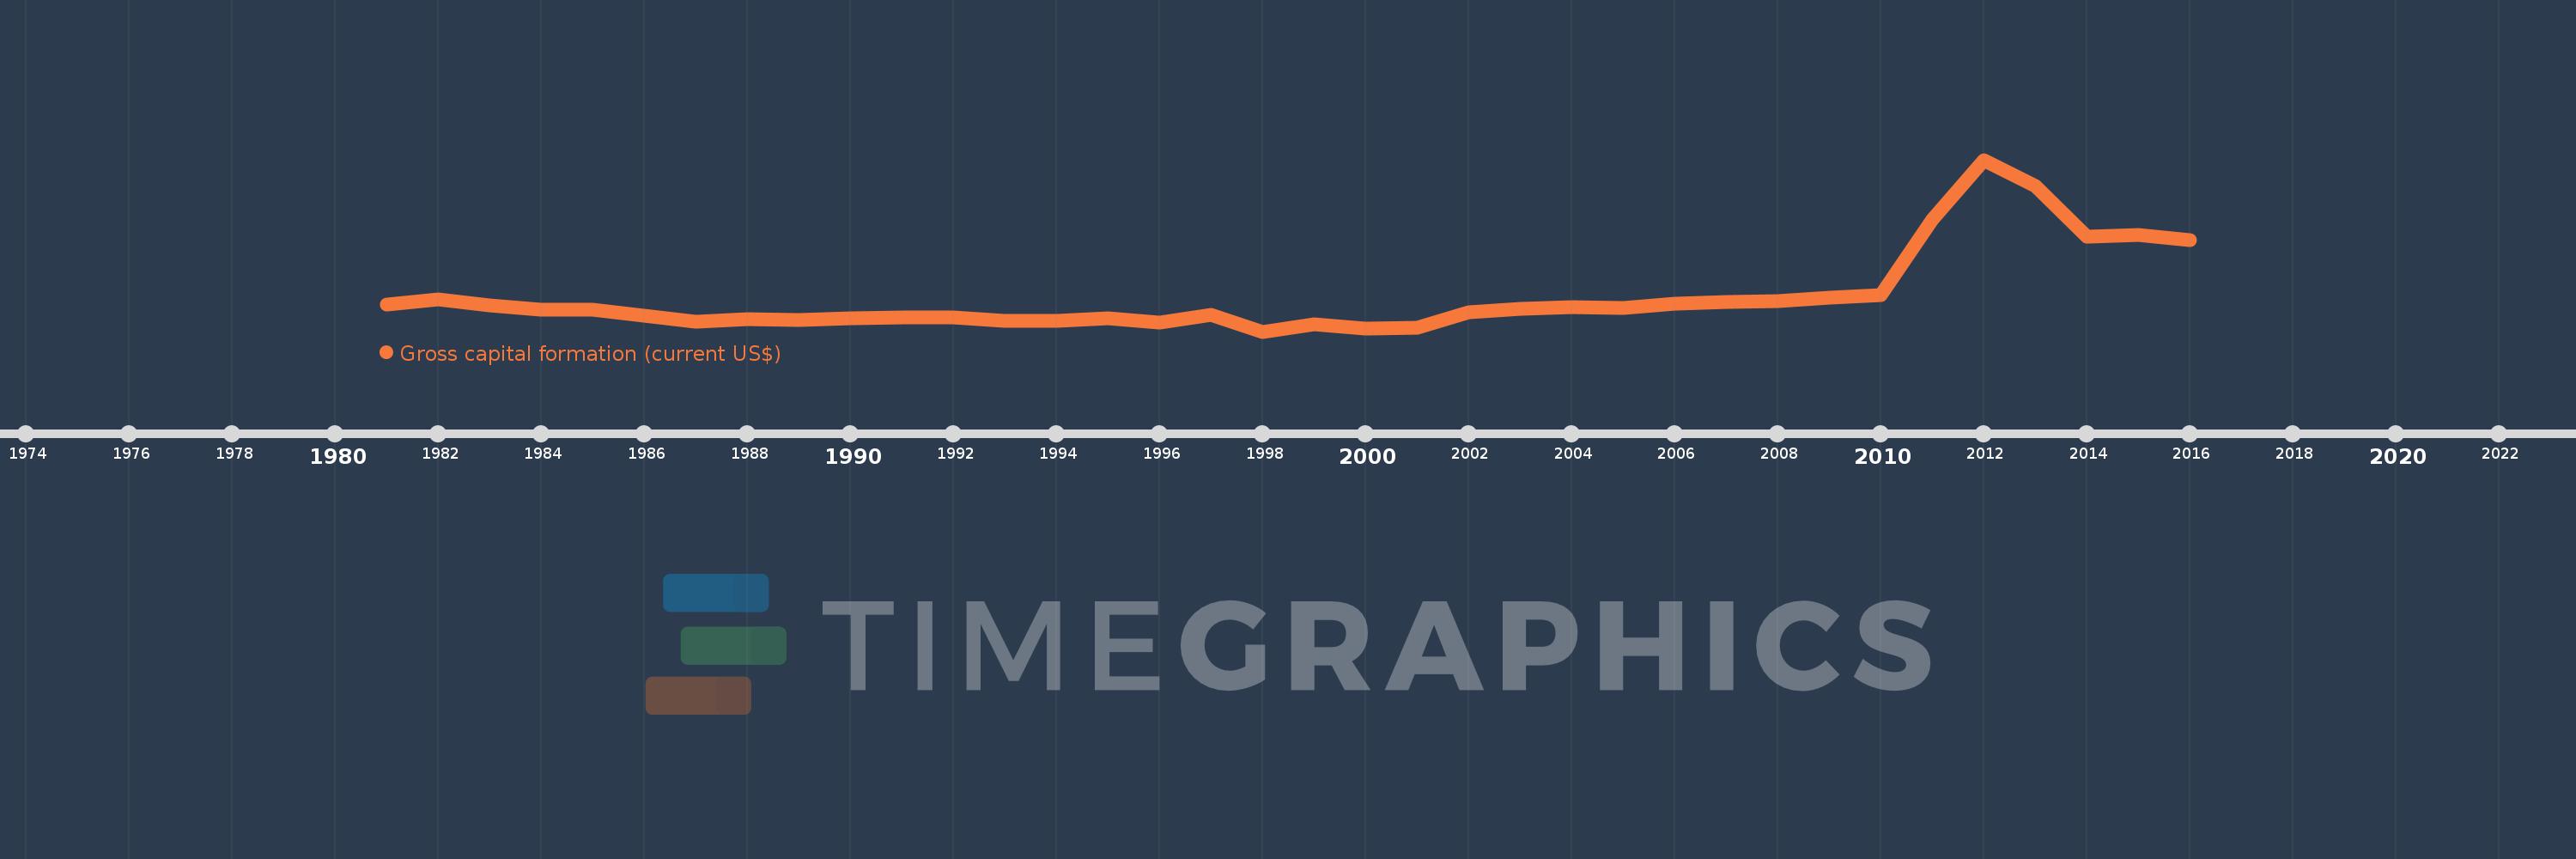
Gross capital formation (current US$)
2016,2015,2014,2013,2012,2011,2010,2009,2008,2007,2006,2005,2004,2003,2002,2001,2000,1999,1998,1997,1996,1995,1994,1993,1992,1991,1990,1989,1988,1987,1986,1985,1984,1983,1982,1981
This statistics in other country:
AfghanistanAlbaniaAlgeriaAngolaAntigua and BarbudaArab WorldArgentinaArmeniaArubaAustraliaAustriaAzerbaijanBahamas, TheBahrainBangladeshBarbadosBelarusBelgiumBelizeBeninBermudaBhutanBoliviaBosnia and HerzegovinaBotswanaBrazilBrunei DarussalamBulgariaBurkina FasoBurundiCabo VerdeCambodiaCameroonCanadaCaribbean small statesCentral African RepublicCentral Europe and the BalticsChadChileChinaColombiaComorosCongo, Dem. Rep.Congo, Rep.Costa RicaCote d'IvoireCroatiaCubaCyprusCzech RepublicDenmarkDjiboutiDominicaDominican RepublicEarly-demographic dividendEast Asia & PacificEast Asia & Pacific (excluding high income)East Asia & Pacific (IDA & IBRD countries)EcuadorEgypt, Arab Rep.El SalvadorEquatorial GuineaEritreaEstoniaEthiopiaEuro areaEurope & Central AsiaEurope & Central Asia (excluding high income)Europe & Central Asia (IDA & IBRD countries)European UnionFaroe IslandsFijiFinlandFragile and conflict affected situationsFranceGabonGambia, TheGeorgiaGermanyGhanaGreeceGrenadaGuatemalaGuineaGuinea-BissauGuyanaHaitiHeavily indebted poor countries (HIPC)High incomeHondurasHong Kong SAR, ChinaHungaryIBRD onlyIcelandIDA & IBRD totalIDA blendIDA onlyIDA totalIndiaIndonesiaIran, Islamic Rep.IraqIrelandIsraelItalyJamaicaJapanJordanKazakhstanKenyaKiribatiKorea, Rep.KosovoKuwaitKyrgyz RepublicLao PDRLate-demographic dividendLatin America & Caribbean Latin America & Caribbean (excluding high income)Latin America & the Caribbean (IDA & IBRD countries)LatviaLeast developed countries: UN classificationLebanonLesothoLiberiaLibyaLithuaniaLow & middle incomeLow incomeLower middle incomeLuxembourgMacao SAR, ChinaMacedonia, FYRMadagascarMalawiMalaysiaMaldivesMaliMaltaMauritaniaMauritiusMexicoMicronesia, Fed. Sts.Middle East & North AfricaMiddle East & North Africa (excluding high income)Middle East & North Africa (IDA & IBRD countries)Middle incomeMoldovaMongoliaMontenegroMoroccoMozambiqueNamibiaNepalNetherlandsNew CaledoniaNew ZealandNicaraguaNigerNigeriaNorth AmericaNorwayOECD membersOmanOther small statesPakistanPanamaPapua New GuineaParaguayPeruPhilippinesPolandPortugalPost-demographic dividendPre-demographic dividendPuerto RicoQatarRomaniaRussian FederationRwandaSaudi ArabiaSenegalSerbiaSeychellesSierra LeoneSingaporeSlovak RepublicSloveniaSmall statesSolomon IslandsSouth AfricaSouth AsiaSouth Asia (IDA & IBRD)South SudanSpainSri LankaSt. Kitts and NevisSt. LuciaSt. Vincent and the GrenadinesSub-Saharan Africa Sub-Saharan Africa (excluding high income)Sub-Saharan Africa (IDA & IBRD countries)SudanSurinameSwazilandSwedenSwitzerlandSyrian Arab RepublicTajikistanTanzaniaThailandTimor-LesteTogoTongaTrinidad and TobagoTunisiaTurkeyTurkmenistanUgandaUkraineUnited Arab EmiratesUnited KingdomUnited StatesUpper middle incomeUruguayUzbekistanVanuatuVenezuela, RBVietnamWest Bank and GazaWorldYemen, Rep.ZambiaZimbabwe Timeline:
This timeline shows a graph from 1981 to 2016 of Sierra Leone. No data until 1980. Number of actual observations by date: 36.
Source name:
World Development Indicators
Source organization:
World Bank national accounts data, and OECD National Accounts data files.
Categories, topics:
Economy & Growth
Last updated:
apr 23, 2017
Indicators value changes by year
Minimum:
-20.612 mln
jan 1, 1998
Maximum:
1.237 bln
jan 1, 2012
At the date of observation
Value
Absolute change
Change from previous value
jan 1, 1981
178.415 mln
+178.415 mln
0.0%
jan 1, 1982
212.838 mln
+34.423 mln
19.29%
jan 1, 1983
173.334 mln
-39.504 mln
-18.56%
jan 1, 1984
142.097 mln
-31.237 mln
-18.02%
jan 1, 1985
138.17 mln
-3.927 mln
-2.76%
jan 1, 1986
93.6 mln
-44.57 mln
-32.26%
jan 1, 1987
52.138 mln
-41.463 mln
-44.3%
jan 1, 1988
71.435 mln
+19.298 mln
37.01%
jan 1, 1989
62.189 mln
-9.247 mln
-12.94%
jan 1, 1990
77.675 mln
+15.487 mln
24.9%
jan 1, 1991
84.492 mln
+6.817 mln
8.78%
jan 1, 1992
85.087 mln
+594.906K
0.7%
jan 1, 1993
56.914 mln
-28.173 mln
-33.11%
jan 1, 1994
59.568 mln
+2.654 mln
4.66%
jan 1, 1995
79.006 mln
+19.438 mln
32.63%
jan 1, 1996
48.526 mln
-30.48 mln
-38.58%
jan 1, 1997
103.931 mln
+55.404 mln
114.17%
jan 1, 1998
-20.612 mln
-124.543 mln
-119.83%
jan 1, 1999
35.727 mln
+56.339 mln
-273.33%
jan 1, 2000
1.96 mln
-33.766 mln
-94.51%
jan 1, 2001
6.974 mln
+5.014 mln
255.76%
jan 1, 2002
118.492 mln
+111.517 mln
1.6K%
jan 1, 2003
146.286 mln
+27.795 mln
23.46%
jan 1, 2004
155.588 mln
+9.302 mln
6.36%
jan 1, 2005
149.561 mln
-6.027 mln
-3.87%
jan 1, 2006
186.5 mln
+36.939 mln
24.7%
jan 1, 2007
195.652 mln
+9.152 mln
4.91%
jan 1, 2008
204.051 mln
+8.399 mln
4.29%
jan 1, 2009
228.293 mln
+24.242 mln
11.88%
jan 1, 2010
245.23 mln
+16.937 mln
7.42%
jan 1, 2011
801.485 mln
+556.255 mln
226.83%
jan 1, 2012
1.237 bln
+435.478 mln
54.33%
jan 1, 2013
1.045 bln
-192.339 mln
-15.55%
jan 1, 2014
677.104 mln
-367.52 mln
-35.18%
jan 1, 2015
686.531 mln
+9.427 mln
1.39%
jan 1, 2016
651.052 mln
-35.479 mln
-5.17%
Ranking of countries by current statistics by years


Comments: