29
/
en
AIzaSyAYiBZKx7MnpbEhh9jyipgxe19OcubqV5w
April 1, 2024
86586
Bhutan
BTN
true
2
1
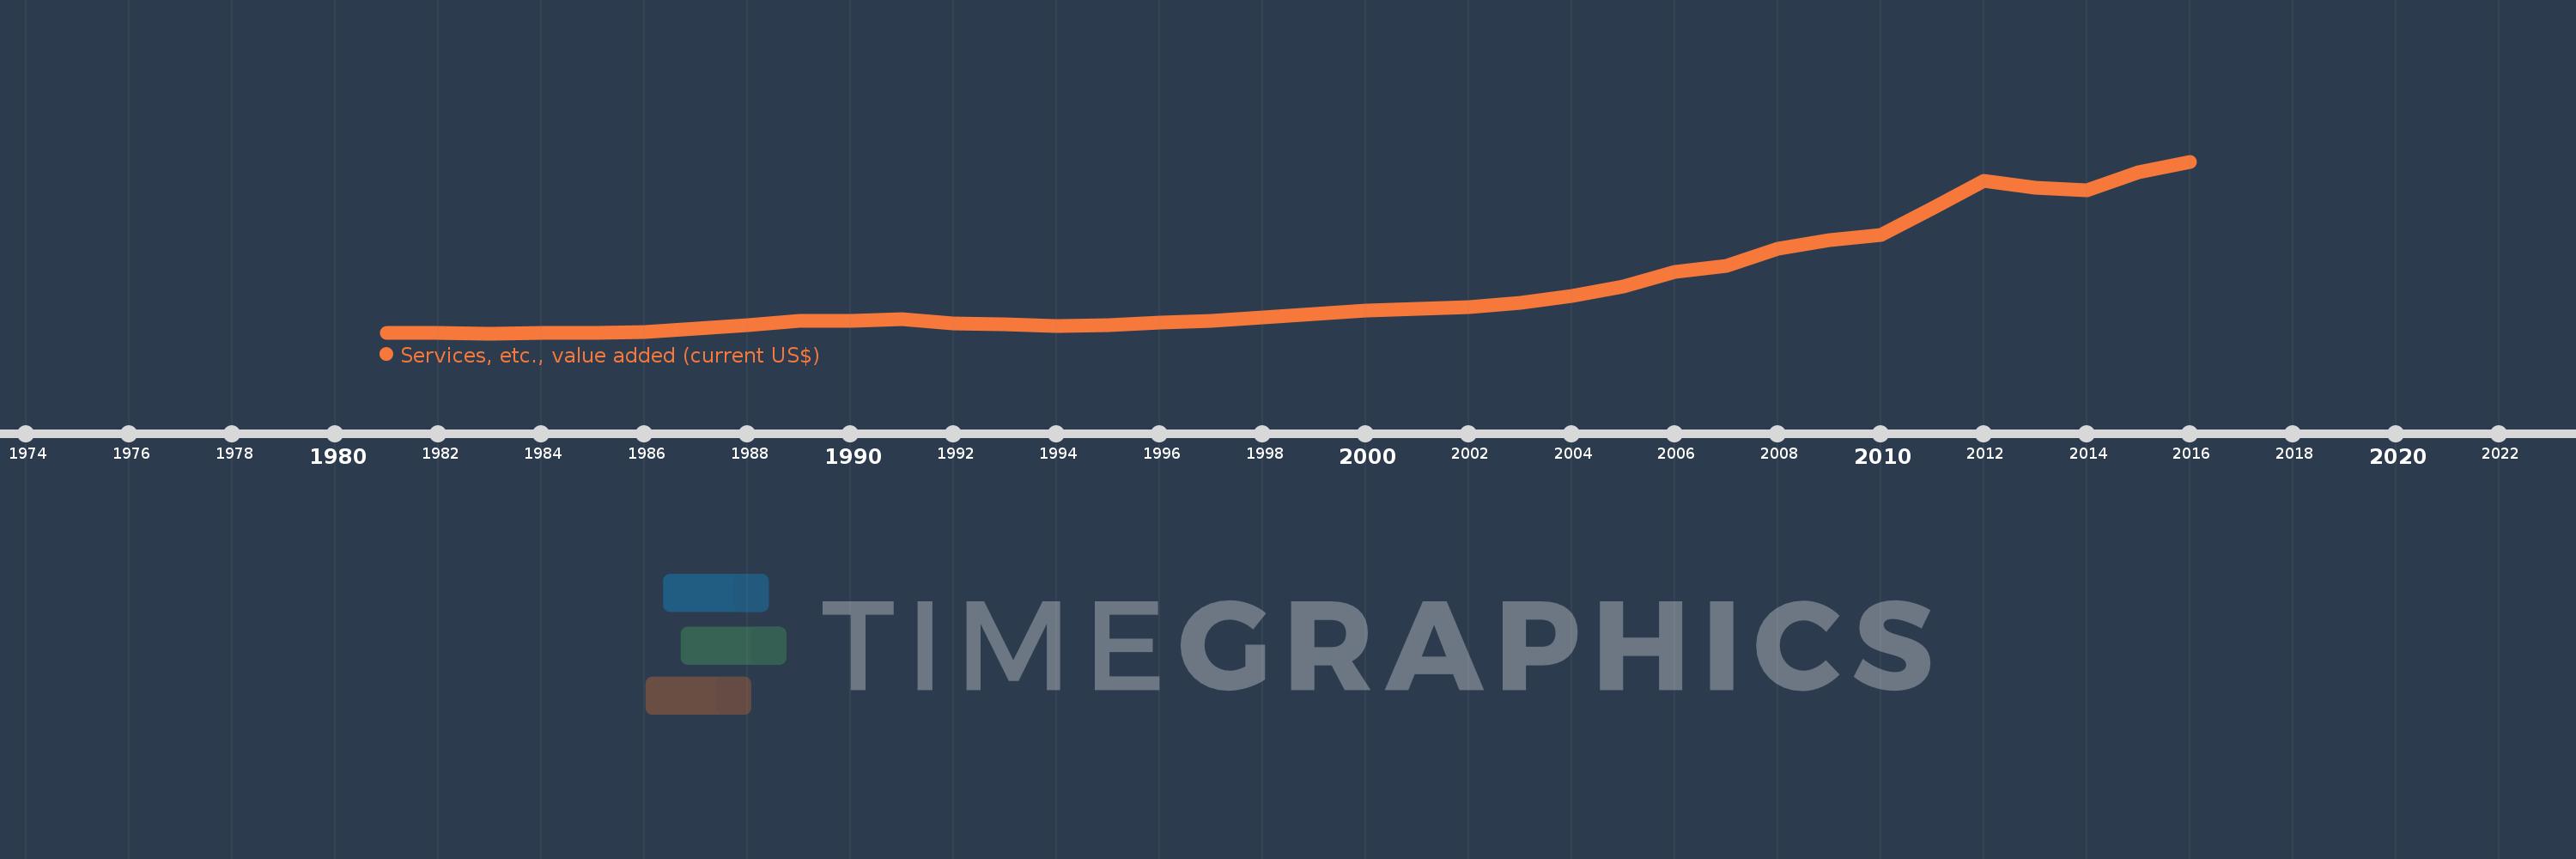
Services, etc., value added (current US$)
2016,2015,2014,2013,2012,2011,2010,2009,2008,2007,2006,2005,2004,2003,2002,2001,2000,1999,1998,1997,1996,1995,1994,1993,1992,1991,1990,1989,1988,1987,1986,1985,1984,1983,1982,1981
This statistics in other country:
AfghanistanAlbaniaAlgeriaAndorraAngolaAntigua and BarbudaArab WorldArgentinaArmeniaArubaAustraliaAustriaAzerbaijanBahamas, TheBahrainBangladeshBarbadosBelarusBelgiumBelizeBeninBermudaBhutanBoliviaBosnia and HerzegovinaBotswanaBrazilBrunei DarussalamBulgariaBurkina FasoBurundiCabo VerdeCambodiaCameroonCanadaCaribbean small statesCentral African RepublicCentral Europe and the BalticsChadChileChinaColombiaComorosCongo, Dem. Rep.Congo, Rep.Costa RicaCote d'IvoireCroatiaCubaCyprusCzech RepublicDenmarkDjiboutiDominicaDominican RepublicEarly-demographic dividendEast Asia & PacificEast Asia & Pacific (excluding high income)East Asia & Pacific (IDA & IBRD countries)EcuadorEgypt, Arab Rep.El SalvadorEquatorial GuineaEritreaEstoniaEthiopiaEuro areaEurope & Central AsiaEurope & Central Asia (excluding high income)Europe & Central Asia (IDA & IBRD countries)European UnionFaroe IslandsFijiFinlandFragile and conflict affected situationsFranceGabonGambia, TheGeorgiaGermanyGhanaGreeceGrenadaGuatemalaGuineaGuinea-BissauGuyanaHeavily indebted poor countries (HIPC)High incomeHondurasHong Kong SAR, ChinaHungaryIBRD onlyIcelandIDA & IBRD totalIDA blendIDA onlyIDA totalIndiaIndonesiaIran, Islamic Rep.IraqIrelandItalyJamaicaJapanJordanKazakhstanKenyaKiribatiKorea, Rep.KosovoKuwaitKyrgyz RepublicLao PDRLate-demographic dividendLatin America & Caribbean Latin America & Caribbean (excluding high income)Latin America & the Caribbean (IDA & IBRD countries)LatviaLeast developed countries: UN classificationLebanonLesothoLiberiaLibyaLithuaniaLow & middle incomeLow incomeLower middle incomeLuxembourgMacao SAR, ChinaMacedonia, FYRMadagascarMalawiMalaysiaMaldivesMaliMaltaMarshall IslandsMauritaniaMauritiusMexicoMicronesia, Fed. Sts.Middle East & North AfricaMiddle East & North Africa (excluding high income)Middle East & North Africa (IDA & IBRD countries)Middle incomeMoldovaMongoliaMontenegroMoroccoMozambiqueMyanmarNamibiaNepalNetherlandsNew CaledoniaNew ZealandNicaraguaNigerNigeriaNorth AmericaNorwayOECD membersOmanOther small statesPacific island small statesPakistanPalauPanamaPapua New GuineaParaguayPeruPhilippinesPolandPortugalPost-demographic dividendPre-demographic dividendPuerto RicoQatarRomaniaRussian FederationRwandaSamoaSao Tome and PrincipeSaudi ArabiaSenegalSerbiaSeychellesSierra LeoneSingaporeSlovak RepublicSloveniaSmall statesSolomon IslandsSouth AfricaSouth AsiaSouth Asia (IDA & IBRD)SpainSri LankaSt. Kitts and NevisSt. LuciaSt. Vincent and the GrenadinesSub-Saharan Africa Sub-Saharan Africa (excluding high income)Sub-Saharan Africa (IDA & IBRD countries)SudanSurinameSwazilandSwedenSwitzerlandSyrian Arab RepublicTajikistanTanzaniaThailandTimor-LesteTogoTongaTrinidad and TobagoTunisiaTurkeyTurkmenistanTuvaluUgandaUkraineUnited Arab EmiratesUnited KingdomUnited StatesUpper middle incomeUruguayUzbekistanVanuatuVenezuela, RBVietnamWest Bank and GazaWorldYemen, Rep.ZambiaZimbabwe Timeline:
This timeline shows a graph from 1981 to 2016 of Bhutan. No data until 1980. Number of actual observations by date: 36.
Source name:
World Development Indicators
Source organization:
World Bank national accounts data, and OECD National Accounts data files.
Categories, topics:
Economy & Growth
Last updated:
apr 23, 2017
Indicators value changes by year
Minimum:
56.331 mln
jan 1, 1983
Maximum:
774.888 mln
jan 1, 2016
At the date of observation
Value
Absolute change
Change from previous value
jan 1, 1981
59.506 mln
+59.506 mln
0.0%
jan 1, 1982
59.266 mln
-239.516K
-0.4%
jan 1, 1983
56.331 mln
-2.935 mln
-4.95%
jan 1, 1984
58.825 mln
+2.494 mln
4.43%
jan 1, 1985
58.728 mln
-97.571K
-0.17%
jan 1, 1986
62.056 mln
+3.328 mln
5.67%
jan 1, 1987
74.787 mln
+12.731 mln
20.52%
jan 1, 1988
91.985 mln
+17.198 mln
23.0%
jan 1, 1989
107.309 mln
+15.325 mln
16.66%
jan 1, 1990
109.757 mln
+2.447 mln
2.28%
jan 1, 1991
116.471 mln
+6.714 mln
6.12%
jan 1, 1992
98.184 mln
-18.287 mln
-15.7%
jan 1, 1993
92.649 mln
-5.535 mln
-5.64%
jan 1, 1994
87.647 mln
-5.002 mln
-5.4%
jan 1, 1995
91.319 mln
+3.672 mln
4.19%
jan 1, 1996
99.67 mln
+8.351 mln
9.15%
jan 1, 1997
107.425 mln
+7.755 mln
7.78%
jan 1, 1998
123.242 mln
+15.817 mln
14.72%
jan 1, 1999
136.636 mln
+13.394 mln
10.87%
jan 1, 2000
150.043 mln
+13.407 mln
9.81%
jan 1, 2001
157.366 mln
+7.323 mln
4.88%
jan 1, 2002
167.644 mln
+10.278 mln
6.53%
jan 1, 2003
182.405 mln
+14.761 mln
8.8%
jan 1, 2004
213.483 mln
+31.078 mln
17.04%
jan 1, 2005
252.361 mln
+38.878 mln
18.21%
jan 1, 2006
311.866 mln
+59.505 mln
23.58%
jan 1, 2007
337.551 mln
+25.684 mln
8.24%
jan 1, 2008
410.976 mln
+73.425 mln
21.75%
jan 1, 2009
446.022 mln
+35.046 mln
8.53%
jan 1, 2010
468.243 mln
+22.221 mln
4.98%
jan 1, 2011
577.579 mln
+109.335 mln
23.35%
jan 1, 2012
693.042 mln
+115.464 mln
19.99%
jan 1, 2013
664.78 mln
-28.262 mln
-4.08%
jan 1, 2014
653.352 mln
-11.428 mln
-1.72%
jan 1, 2015
729.172 mln
+75.82 mln
11.6%
jan 1, 2016
774.888 mln
+45.716 mln
6.27%
Ranking of countries by current statistics by years


Comments: