29
/
en
AIzaSyAYiBZKx7MnpbEhh9jyipgxe19OcubqV5w
April 1, 2024
179524
Liberia
LBR
true
2
1
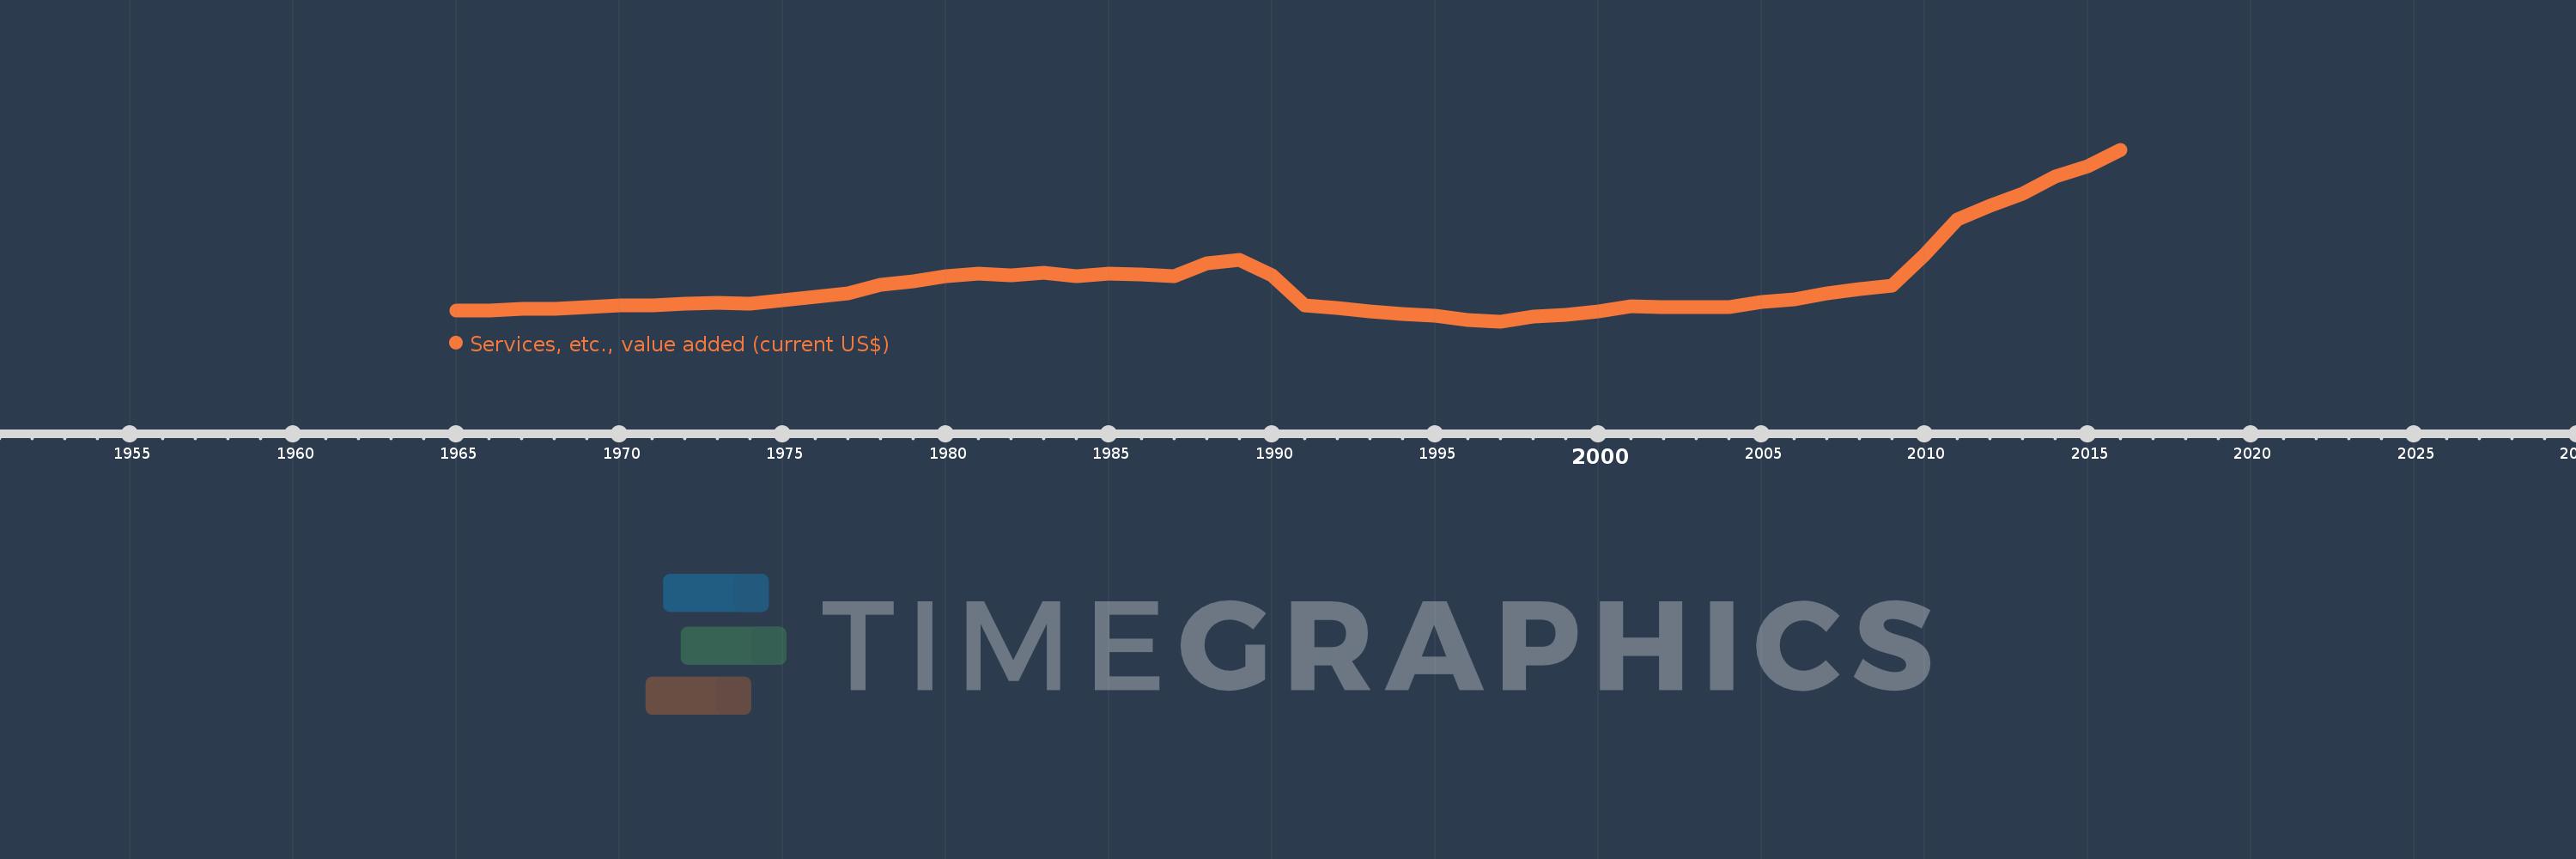
Services, etc., value added (current US$)
2016,2015,2014,2013,2012,2011,2010,2009,2008,2007,2006,2005,2004,2003,2002,2001,2000,1999,1998,1997,1996,1995,1994,1993,1992,1991,1990,1989,1988,1987,1986,1985,1984,1983,1982,1981,1980,1979,1978,1977,1976,1975,1974,1973,1972,1971,1970,1969,1968,1967,1966,1965
This statistics in other country:
AfghanistanAlbaniaAlgeriaAndorraAngolaAntigua and BarbudaArab WorldArgentinaArmeniaArubaAustraliaAustriaAzerbaijanBahamas, TheBahrainBangladeshBarbadosBelarusBelgiumBelizeBeninBermudaBhutanBoliviaBosnia and HerzegovinaBotswanaBrazilBrunei DarussalamBulgariaBurkina FasoBurundiCabo VerdeCambodiaCameroonCanadaCaribbean small statesCentral African RepublicCentral Europe and the BalticsChadChileChinaColombiaComorosCongo, Dem. Rep.Congo, Rep.Costa RicaCote d'IvoireCroatiaCubaCyprusCzech RepublicDenmarkDjiboutiDominicaDominican RepublicEarly-demographic dividendEast Asia & PacificEast Asia & Pacific (excluding high income)East Asia & Pacific (IDA & IBRD countries)EcuadorEgypt, Arab Rep.El SalvadorEquatorial GuineaEritreaEstoniaEthiopiaEuro areaEurope & Central AsiaEurope & Central Asia (excluding high income)Europe & Central Asia (IDA & IBRD countries)European UnionFaroe IslandsFijiFinlandFragile and conflict affected situationsFranceGabonGambia, TheGeorgiaGermanyGhanaGreeceGrenadaGuatemalaGuineaGuinea-BissauGuyanaHeavily indebted poor countries (HIPC)High incomeHondurasHong Kong SAR, ChinaHungaryIBRD onlyIcelandIDA & IBRD totalIDA blendIDA onlyIDA totalIndiaIndonesiaIran, Islamic Rep.IraqIrelandItalyJamaicaJapanJordanKazakhstanKenyaKiribatiKorea, Rep.KosovoKuwaitKyrgyz RepublicLao PDRLate-demographic dividendLatin America & Caribbean Latin America & Caribbean (excluding high income)Latin America & the Caribbean (IDA & IBRD countries)LatviaLeast developed countries: UN classificationLebanonLesothoLiberiaLibyaLithuaniaLow & middle incomeLow incomeLower middle incomeLuxembourgMacao SAR, ChinaMacedonia, FYRMadagascarMalawiMalaysiaMaldivesMaliMaltaMarshall IslandsMauritaniaMauritiusMexicoMicronesia, Fed. Sts.Middle East & North AfricaMiddle East & North Africa (excluding high income)Middle East & North Africa (IDA & IBRD countries)Middle incomeMoldovaMongoliaMontenegroMoroccoMozambiqueMyanmarNamibiaNepalNetherlandsNew CaledoniaNew ZealandNicaraguaNigerNigeriaNorth AmericaNorwayOECD membersOmanOther small statesPacific island small statesPakistanPalauPanamaPapua New GuineaParaguayPeruPhilippinesPolandPortugalPost-demographic dividendPre-demographic dividendPuerto RicoQatarRomaniaRussian FederationRwandaSamoaSao Tome and PrincipeSaudi ArabiaSenegalSerbiaSeychellesSierra LeoneSingaporeSlovak RepublicSloveniaSmall statesSolomon IslandsSouth AfricaSouth AsiaSouth Asia (IDA & IBRD)SpainSri LankaSt. Kitts and NevisSt. LuciaSt. Vincent and the GrenadinesSub-Saharan Africa Sub-Saharan Africa (excluding high income)Sub-Saharan Africa (IDA & IBRD countries)SudanSurinameSwazilandSwedenSwitzerlandSyrian Arab RepublicTajikistanTanzaniaThailandTimor-LesteTogoTongaTrinidad and TobagoTunisiaTurkeyTurkmenistanTuvaluUgandaUkraineUnited Arab EmiratesUnited KingdomUnited StatesUpper middle incomeUruguayUzbekistanVanuatuVenezuela, RBVietnamWest Bank and GazaWorldYemen, Rep.ZambiaZimbabwe Timeline:
This timeline shows a graph from 1965 to 2016 of Liberia. No data until 1964. Number of actual observations by date: 52.
Source name:
World Development Indicators
Source organization:
World Bank national accounts data, and OECD National Accounts data files.
Categories, topics:
Economy & Growth
Last updated:
apr 23, 2017
Indicators value changes by year
Minimum:
6.6 mln
jan 1, 1997
Maximum:
1.08 bln
jan 1, 2016
At the date of observation
Value
Absolute change
Change from previous value
jan 1, 1965
77.359 mln
+77.359 mln
0.0%
jan 1, 1966
76.933 mln
-426.9K
-0.55%
jan 1, 1967
86.496 mln
+9.563 mln
12.43%
jan 1, 1968
90.338 mln
+3.842 mln
4.44%
jan 1, 1969
100.584 mln
+10.246 mln
11.34%
jan 1, 1970
107.501 mln
+6.916 mln
6.88%
jan 1, 1971
111.001 mln
+3.501 mln
3.26%
jan 1, 1972
119.711 mln
+8.709 mln
7.85%
jan 1, 1973
127.396 mln
+7.685 mln
6.42%
jan 1, 1974
123.041 mln
-4.355 mln
-3.42%
jan 1, 1975
140.033 mln
+16.992 mln
13.81%
jan 1, 1976
163.172 mln
+23.14 mln
16.52%
jan 1, 1977
182.982 mln
+19.809 mln
12.14%
jan 1, 1978
238.739 mln
+55.757 mln
30.47%
jan 1, 1979
260.0 mln
+21.261 mln
8.91%
jan 1, 1980
290.824 mln
+30.824 mln
11.86%
jan 1, 1981
307.56 mln
+16.736 mln
5.75%
jan 1, 1982
299.96 mln
-7.599 mln
-2.47%
jan 1, 1983
312.597 mln
+12.637 mln
4.21%
jan 1, 1984
294.495 mln
-18.102 mln
-5.79%
jan 1, 1985
306.193 mln
+11.698 mln
3.97%
jan 1, 1986
304.315 mln
-1.878 mln
-0.61%
jan 1, 1987
293.129 mln
-11.186 mln
-3.68%
jan 1, 1988
375.7 mln
+82.571 mln
28.17%
jan 1, 1989
394.8 mln
+19.1 mln
5.08%
jan 1, 1990
295.6 mln
-99.2 mln
-25.13%
jan 1, 1991
110.8 mln
-184.8 mln
-62.52%
jan 1, 1992
96.2 mln
-14.6 mln
-13.18%
jan 1, 1993
74.0 mln
-22.2 mln
-23.08%
jan 1, 1994
55.0 mln
-19.0 mln
-25.68%
jan 1, 1995
44.3 mln
-10.7 mln
-19.45%
jan 1, 1996
17.4 mln
-26.9 mln
-60.72%
jan 1, 1997
6.6 mln
-10.8 mln
-62.07%
jan 1, 1998
37.9 mln
+31.3 mln
474.24%
jan 1, 1999
51.3 mln
+13.4 mln
35.36%
jan 1, 2000
73.4 mln
+22.1 mln
43.08%
jan 1, 2001
104.117 mln
+30.717 mln
41.85%
jan 1, 2002
101.0 mln
-3.117 mln
-2.99%
jan 1, 2003
97.0 mln
-4.0 mln
-3.96%
jan 1, 2004
99.0 mln
+2.0 mln
2.06%
jan 1, 2005
129.0 mln
+30.0 mln
30.3%
jan 1, 2006
147.0 mln
+18.0 mln
13.95%
jan 1, 2007
183.016 mln
+36.016 mln
24.5%
jan 1, 2008
210.445 mln
+27.429 mln
14.99%
jan 1, 2009
235.682 mln
+25.237 mln
11.99%
jan 1, 2010
426.879 mln
+191.197 mln
81.13%
jan 1, 2011
648.933 mln
+222.055 mln
52.02%
jan 1, 2012
732.525 mln
+83.591 mln
12.88%
jan 1, 2013
809.504 mln
+76.979 mln
10.51%
jan 1, 2014
915.135 mln
+105.632 mln
13.05%
jan 1, 2015
977.0 mln
+61.865 mln
6.76%
jan 1, 2016
1.08 bln
+102.9 mln
10.53%
Ranking of countries by current statistics by years


Comments: