29
/
en
AIzaSyAYiBZKx7MnpbEhh9jyipgxe19OcubqV5w
April 1, 2024
24524
Arab World
ARB
false
2
1
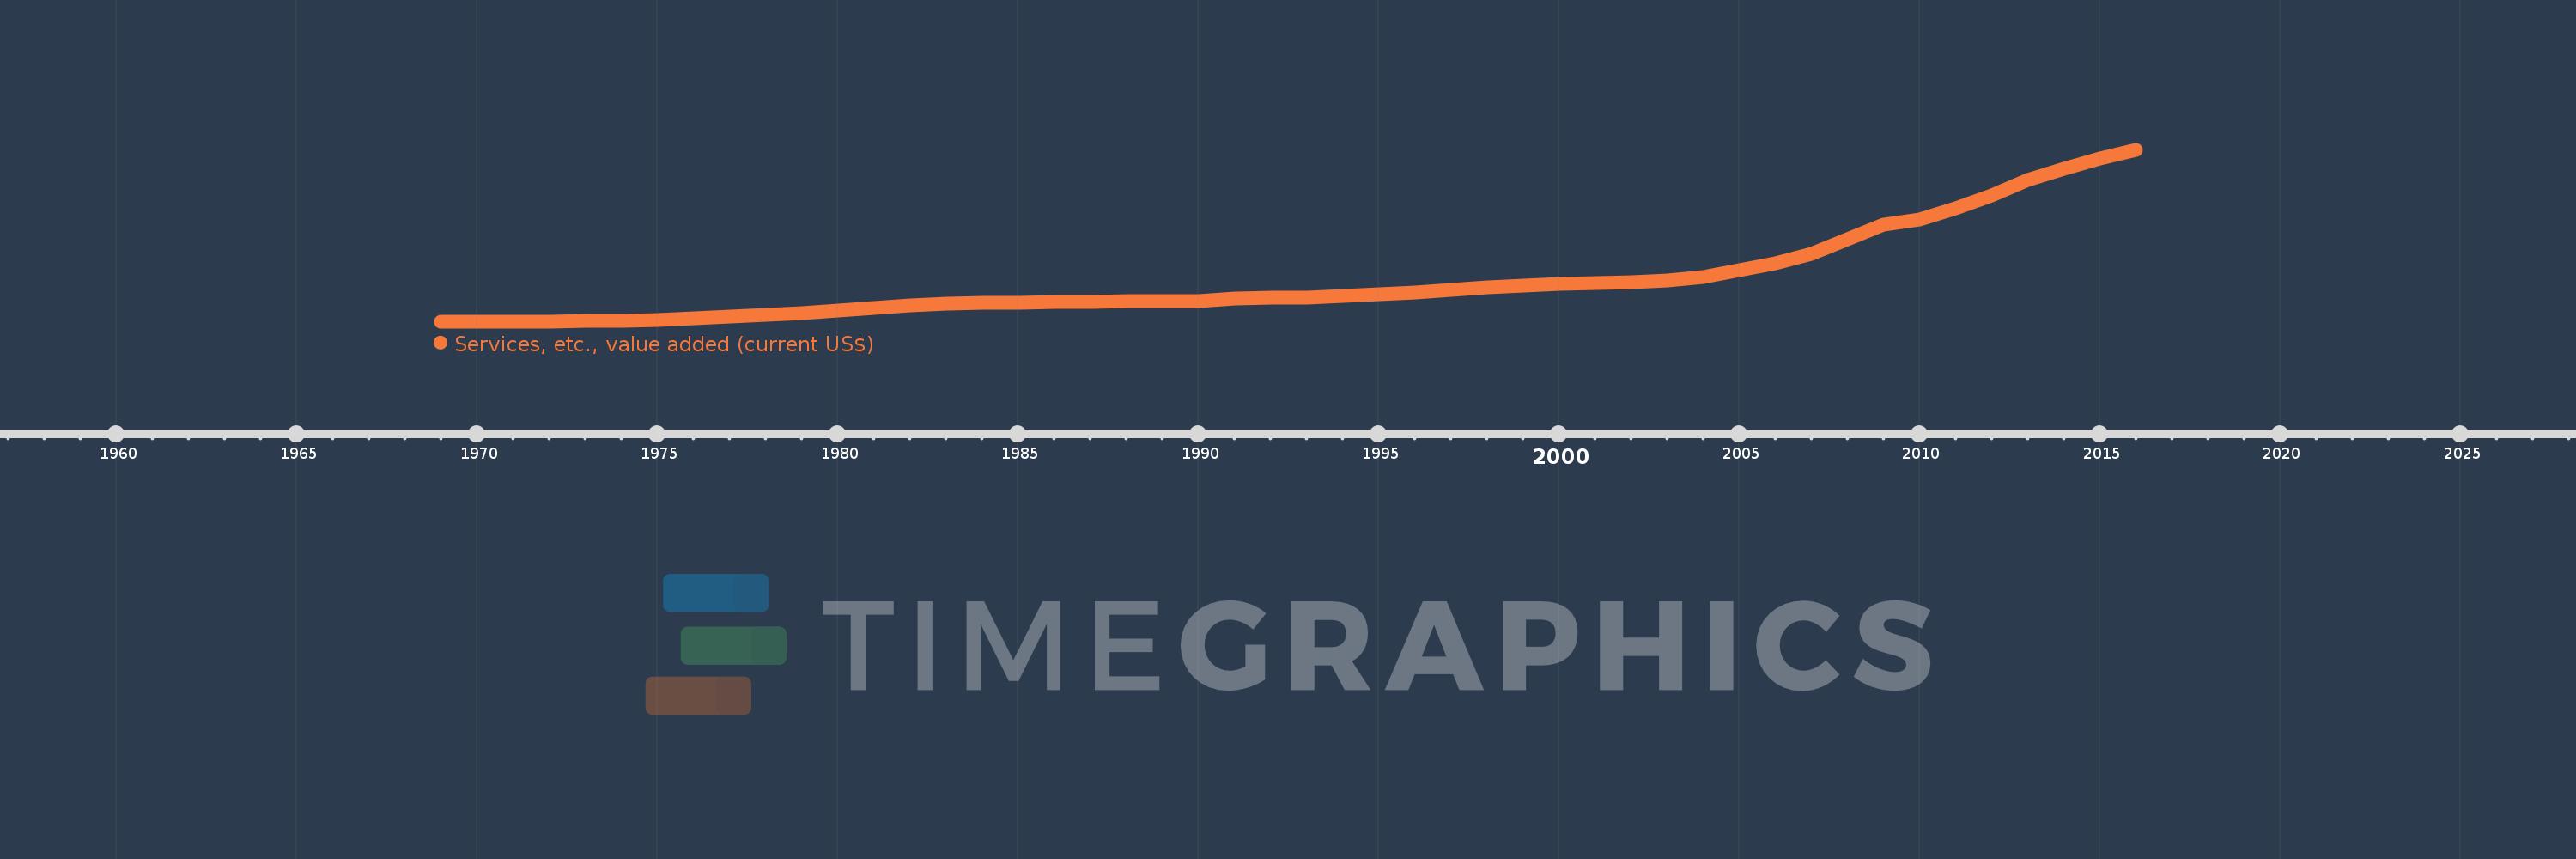
Services, etc., value added (current US$)
2016,2015,2014,2013,2012,2011,2010,2009,2008,2007,2006,2005,2004,2003,2002,2001,2000,1999,1998,1997,1996,1995,1994,1993,1992,1991,1990,1989,1988,1987,1986,1985,1984,1983,1982,1981,1980,1979,1978,1977,1976,1975,1974,1973,1972,1971,1970,1969
This statistics in other country:
AfghanistanAlbaniaAlgeriaAndorraAngolaAntigua and BarbudaArab WorldArgentinaArmeniaArubaAustraliaAustriaAzerbaijanBahamas, TheBahrainBangladeshBarbadosBelarusBelgiumBelizeBeninBermudaBhutanBoliviaBosnia and HerzegovinaBotswanaBrazilBrunei DarussalamBulgariaBurkina FasoBurundiCabo VerdeCambodiaCameroonCanadaCaribbean small statesCentral African RepublicCentral Europe and the BalticsChadChileChinaColombiaComorosCongo, Dem. Rep.Congo, Rep.Costa RicaCote d'IvoireCroatiaCubaCyprusCzech RepublicDenmarkDjiboutiDominicaDominican RepublicEarly-demographic dividendEast Asia & PacificEast Asia & Pacific (excluding high income)East Asia & Pacific (IDA & IBRD countries)EcuadorEgypt, Arab Rep.El SalvadorEquatorial GuineaEritreaEstoniaEthiopiaEuro areaEurope & Central AsiaEurope & Central Asia (excluding high income)Europe & Central Asia (IDA & IBRD countries)European UnionFaroe IslandsFijiFinlandFragile and conflict affected situationsFranceGabonGambia, TheGeorgiaGermanyGhanaGreeceGrenadaGuatemalaGuineaGuinea-BissauGuyanaHeavily indebted poor countries (HIPC)High incomeHondurasHong Kong SAR, ChinaHungaryIBRD onlyIcelandIDA & IBRD totalIDA blendIDA onlyIDA totalIndiaIndonesiaIran, Islamic Rep.IraqIrelandItalyJamaicaJapanJordanKazakhstanKenyaKiribatiKorea, Rep.KosovoKuwaitKyrgyz RepublicLao PDRLate-demographic dividendLatin America & Caribbean Latin America & Caribbean (excluding high income)Latin America & the Caribbean (IDA & IBRD countries)LatviaLeast developed countries: UN classificationLebanonLesothoLiberiaLibyaLithuaniaLow & middle incomeLow incomeLower middle incomeLuxembourgMacao SAR, ChinaMacedonia, FYRMadagascarMalawiMalaysiaMaldivesMaliMaltaMarshall IslandsMauritaniaMauritiusMexicoMicronesia, Fed. Sts.Middle East & North AfricaMiddle East & North Africa (excluding high income)Middle East & North Africa (IDA & IBRD countries)Middle incomeMoldovaMongoliaMontenegroMoroccoMozambiqueMyanmarNamibiaNepalNetherlandsNew CaledoniaNew ZealandNicaraguaNigerNigeriaNorth AmericaNorwayOECD membersOmanOther small statesPacific island small statesPakistanPalauPanamaPapua New GuineaParaguayPeruPhilippinesPolandPortugalPost-demographic dividendPre-demographic dividendPuerto RicoQatarRomaniaRussian FederationRwandaSamoaSao Tome and PrincipeSaudi ArabiaSenegalSerbiaSeychellesSierra LeoneSingaporeSlovak RepublicSloveniaSmall statesSolomon IslandsSouth AfricaSouth AsiaSouth Asia (IDA & IBRD)SpainSri LankaSt. Kitts and NevisSt. LuciaSt. Vincent and the GrenadinesSub-Saharan Africa Sub-Saharan Africa (excluding high income)Sub-Saharan Africa (IDA & IBRD countries)SudanSurinameSwazilandSwedenSwitzerlandSyrian Arab RepublicTajikistanTanzaniaThailandTimor-LesteTogoTongaTrinidad and TobagoTunisiaTurkeyTurkmenistanTuvaluUgandaUkraineUnited Arab EmiratesUnited KingdomUnited StatesUpper middle incomeUruguayUzbekistanVanuatuVenezuela, RBVietnamWest Bank and GazaWorldYemen, Rep.ZambiaZimbabwe Timeline:
This timeline shows a graph from 1969 to 2016 of Arab World. No data until 1968. Number of actual observations by date: 48.
Source name:
World Development Indicators
Source organization:
World Bank national accounts data, and OECD National Accounts data files.
Categories, topics:
Economy & Growth
Last updated:
apr 23, 2017
Indicators value changes by year
Minimum:
12.189 bln
jan 1, 1969
Maximum:
1.341 trl
jan 1, 2016
At the date of observation
Value
Absolute change
Change from previous value
jan 1, 1969
12.189 bln
+12.189 bln
0.0%
jan 1, 1970
13.597 bln
+1.408 bln
11.55%
jan 1, 1971
14.939 bln
+1.342 bln
9.87%
jan 1, 1972
16.366 bln
+1.427 bln
9.55%
jan 1, 1973
19.193 bln
+2.827 bln
17.27%
jan 1, 1974
24.011 bln
+4.818 bln
25.1%
jan 1, 1975
30.578 bln
+6.567 bln
27.35%
jan 1, 1976
43.184 bln
+12.607 bln
41.23%
jan 1, 1977
54.437 bln
+11.253 bln
26.06%
jan 1, 1978
67.82 bln
+13.382 bln
24.58%
jan 1, 1979
80.179 bln
+12.36 bln
18.22%
jan 1, 1980
98.696 bln
+18.517 bln
23.09%
jan 1, 1981
122.309 bln
+23.613 bln
23.92%
jan 1, 1982
137.629 bln
+15.32 bln
12.53%
jan 1, 1983
153.069 bln
+15.44 bln
11.22%
jan 1, 1984
158.431 bln
+5.362 bln
3.5%
jan 1, 1985
162.733 bln
+4.302 bln
2.72%
jan 1, 1986
165.306 bln
+2.573 bln
1.58%
jan 1, 1987
167.426 bln
+2.12 bln
1.28%
jan 1, 1988
173.507 bln
+6.08 bln
3.63%
jan 1, 1989
172.708 bln
-798.631 mln
-0.46%
jan 1, 1990
175.858 bln
+3.15 bln
1.82%
jan 1, 1991
194.614 bln
+18.757 bln
10.67%
jan 1, 1992
200.382 bln
+5.768 bln
2.96%
jan 1, 1993
201.845 bln
+1.462 bln
0.73%
jan 1, 1994
213.229 bln
+11.384 bln
5.64%
jan 1, 1995
224.763 bln
+11.534 bln
5.41%
jan 1, 1996
243.128 bln
+18.365 bln
8.17%
jan 1, 1997
257.311 bln
+14.183 bln
5.83%
jan 1, 1998
280.179 bln
+22.867 bln
8.89%
jan 1, 1999
293.601 bln
+13.422 bln
4.79%
jan 1, 2000
304.253 bln
+10.652 bln
3.63%
jan 1, 2001
316.137 bln
+11.884 bln
3.91%
jan 1, 2002
322.935 bln
+6.798 bln
2.15%
jan 1, 2003
332.805 bln
+9.87 bln
3.06%
jan 1, 2004
358.668 bln
+25.863 bln
7.77%
jan 1, 2005
411.866 bln
+53.197 bln
14.83%
jan 1, 2006
463.852 bln
+51.986 bln
12.62%
jan 1, 2007
542.144 bln
+78.293 bln
16.88%
jan 1, 2008
653.347 bln
+111.203 bln
20.51%
jan 1, 2009
767.904 bln
+114.556 bln
17.53%
jan 1, 2010
806.665 bln
+38.762 bln
5.05%
jan 1, 2011
894.209 bln
+87.544 bln
10.85%
jan 1, 2012
987.598 bln
+93.39 bln
10.44%
jan 1, 2013
1.111 trl
+122.909 bln
12.45%
jan 1, 2014
1.195 trl
+84.741 bln
7.63%
jan 1, 2015
1.275 trl
+80.148 bln
6.71%
jan 1, 2016
1.341 trl
+65.467 bln
5.13%
Ranking of countries by current statistics by years


Comments: