29
/
en
AIzaSyAYiBZKx7MnpbEhh9jyipgxe19OcubqV5w
April 1, 2024
254650
Suriname
SUR
true
2
1
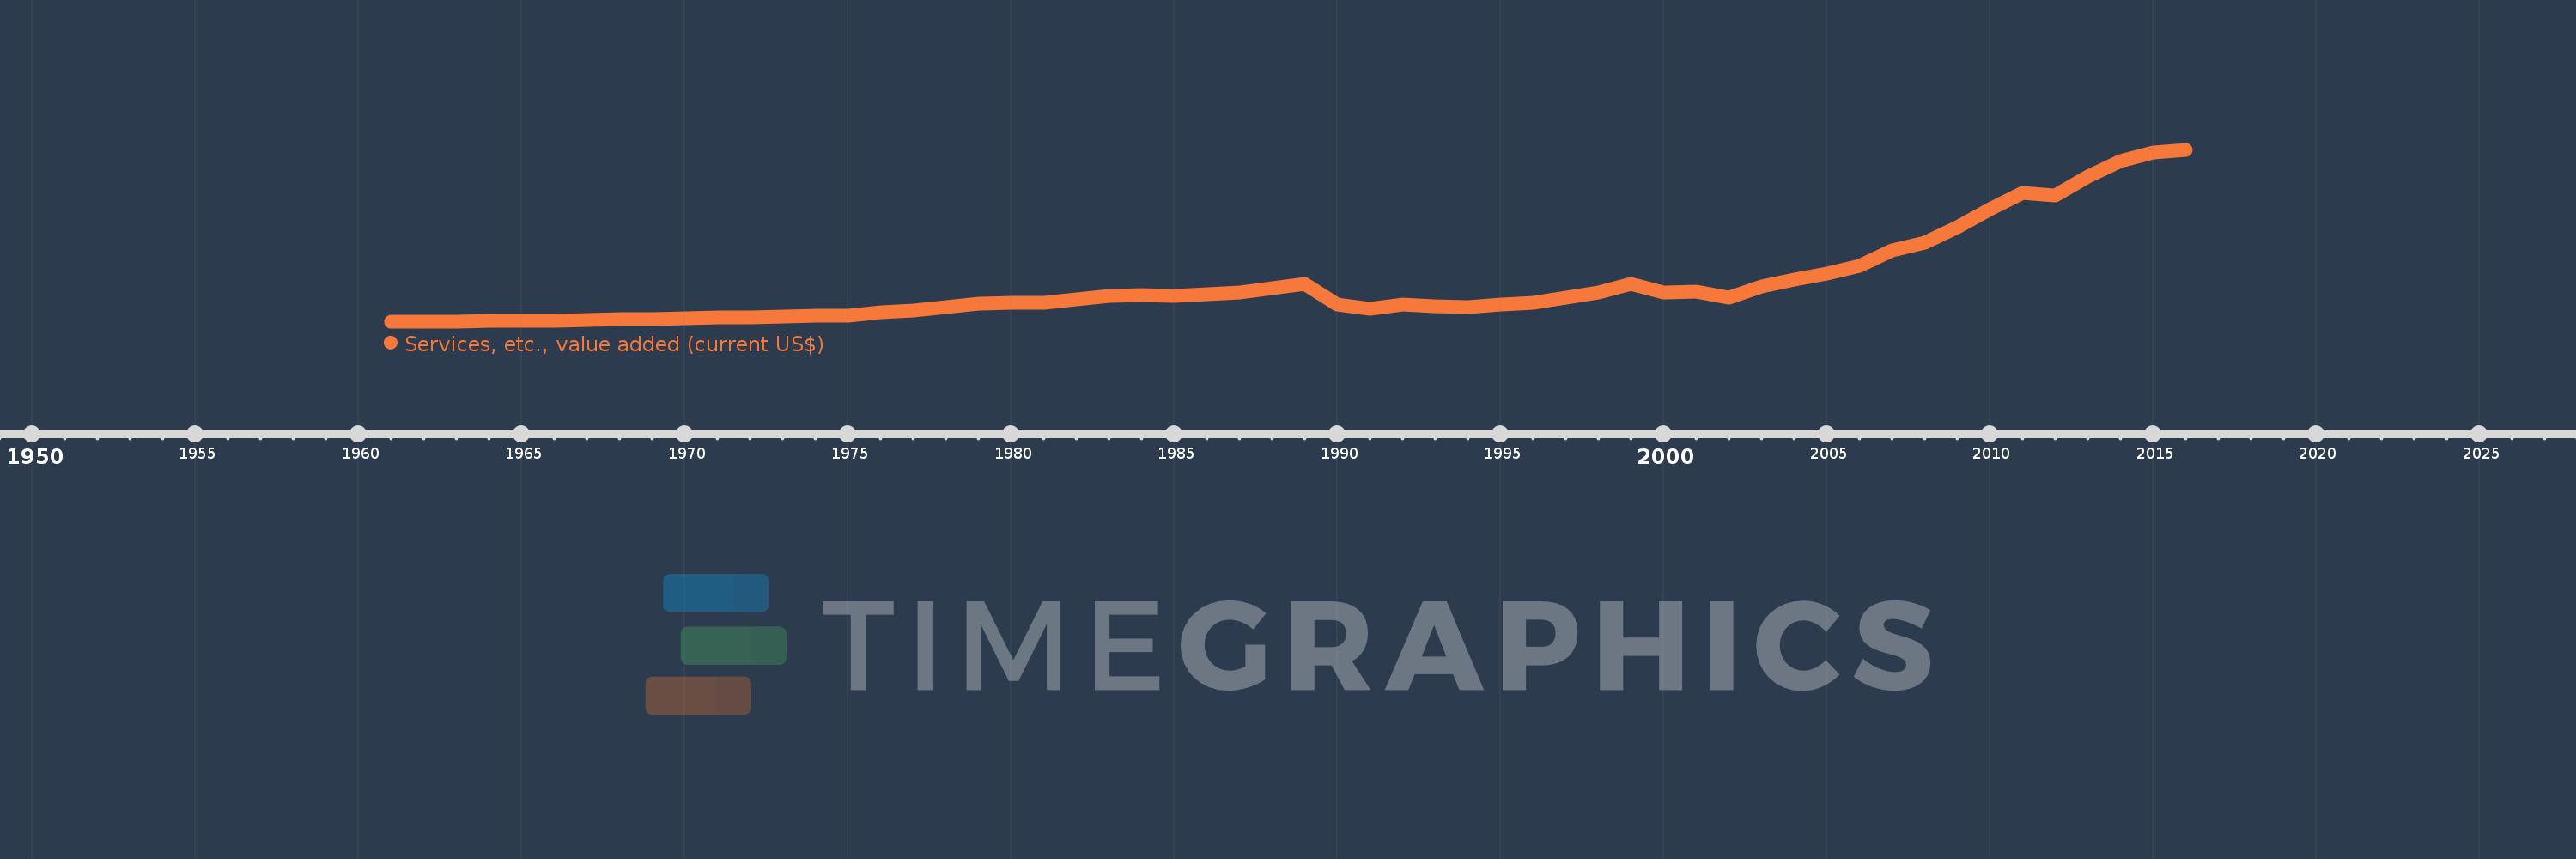
Services, etc., value added (current US$)
2016,2015,2014,2013,2012,2011,2010,2009,2008,2007,2006,2005,2004,2003,2002,2001,2000,1999,1998,1997,1996,1995,1994,1993,1992,1991,1990,1989,1988,1987,1986,1985,1984,1983,1982,1981,1980,1979,1978,1977,1976,1975,1974,1973,1972,1971,1970,1969,1968,1967,1966,1965,1964,1963,1962,1961
This statistics in other country:
AfghanistanAlbaniaAlgeriaAndorraAngolaAntigua and BarbudaArab WorldArgentinaArmeniaArubaAustraliaAustriaAzerbaijanBahamas, TheBahrainBangladeshBarbadosBelarusBelgiumBelizeBeninBermudaBhutanBoliviaBosnia and HerzegovinaBotswanaBrazilBrunei DarussalamBulgariaBurkina FasoBurundiCabo VerdeCambodiaCameroonCanadaCaribbean small statesCentral African RepublicCentral Europe and the BalticsChadChileChinaColombiaComorosCongo, Dem. Rep.Congo, Rep.Costa RicaCote d'IvoireCroatiaCubaCyprusCzech RepublicDenmarkDjiboutiDominicaDominican RepublicEarly-demographic dividendEast Asia & PacificEast Asia & Pacific (excluding high income)East Asia & Pacific (IDA & IBRD countries)EcuadorEgypt, Arab Rep.El SalvadorEquatorial GuineaEritreaEstoniaEthiopiaEuro areaEurope & Central AsiaEurope & Central Asia (excluding high income)Europe & Central Asia (IDA & IBRD countries)European UnionFaroe IslandsFijiFinlandFragile and conflict affected situationsFranceGabonGambia, TheGeorgiaGermanyGhanaGreeceGrenadaGuatemalaGuineaGuinea-BissauGuyanaHeavily indebted poor countries (HIPC)High incomeHondurasHong Kong SAR, ChinaHungaryIBRD onlyIcelandIDA & IBRD totalIDA blendIDA onlyIDA totalIndiaIndonesiaIran, Islamic Rep.IraqIrelandItalyJamaicaJapanJordanKazakhstanKenyaKiribatiKorea, Rep.KosovoKuwaitKyrgyz RepublicLao PDRLate-demographic dividendLatin America & Caribbean Latin America & Caribbean (excluding high income)Latin America & the Caribbean (IDA & IBRD countries)LatviaLeast developed countries: UN classificationLebanonLesothoLiberiaLibyaLithuaniaLow & middle incomeLow incomeLower middle incomeLuxembourgMacao SAR, ChinaMacedonia, FYRMadagascarMalawiMalaysiaMaldivesMaliMaltaMarshall IslandsMauritaniaMauritiusMexicoMicronesia, Fed. Sts.Middle East & North AfricaMiddle East & North Africa (excluding high income)Middle East & North Africa (IDA & IBRD countries)Middle incomeMoldovaMongoliaMontenegroMoroccoMozambiqueMyanmarNamibiaNepalNetherlandsNew CaledoniaNew ZealandNicaraguaNigerNigeriaNorth AmericaNorwayOECD membersOmanOther small statesPacific island small statesPakistanPalauPanamaPapua New GuineaParaguayPeruPhilippinesPolandPortugalPost-demographic dividendPre-demographic dividendPuerto RicoQatarRomaniaRussian FederationRwandaSamoaSao Tome and PrincipeSaudi ArabiaSenegalSerbiaSeychellesSierra LeoneSingaporeSlovak RepublicSloveniaSmall statesSolomon IslandsSouth AfricaSouth AsiaSouth Asia (IDA & IBRD)SpainSri LankaSt. Kitts and NevisSt. LuciaSt. Vincent and the GrenadinesSub-Saharan Africa Sub-Saharan Africa (excluding high income)Sub-Saharan Africa (IDA & IBRD countries)SudanSurinameSwazilandSwedenSwitzerlandSyrian Arab RepublicTajikistanTanzaniaThailandTimor-LesteTogoTongaTrinidad and TobagoTunisiaTurkeyTurkmenistanTuvaluUgandaUkraineUnited Arab EmiratesUnited KingdomUnited StatesUpper middle incomeUruguayUzbekistanVanuatuVenezuela, RBVietnamWest Bank and GazaWorldYemen, Rep.ZambiaZimbabwe Timeline:
This timeline shows a graph from 1961 to 2016 of Suriname. No data until 1960. Number of actual observations by date: 56.
Source name:
World Development Indicators
Source organization:
World Bank national accounts data, and OECD National Accounts data files.
Categories, topics:
Economy & Growth
Last updated:
apr 23, 2017
Indicators value changes by year
Minimum:
39.1 mln
jan 1, 1961
Maximum:
2.777 bln
jan 1, 2016
At the date of observation
Value
Absolute change
Change from previous value
jan 1, 1961
39.1 mln
+39.1 mln
0.0%
jan 1, 1962
43.85 mln
+4.75 mln
12.15%
jan 1, 1963
48.25 mln
+4.4 mln
10.03%
jan 1, 1964
51.4 mln
+3.15 mln
6.53%
jan 1, 1965
55.9 mln
+4.5 mln
8.75%
jan 1, 1966
62.75 mln
+6.85 mln
12.25%
jan 1, 1967
69.3 mln
+6.55 mln
10.44%
jan 1, 1968
79.05 mln
+9.75 mln
14.07%
jan 1, 1969
88.45 mln
+9.4 mln
11.89%
jan 1, 1970
94.65 mln
+6.2 mln
7.01%
jan 1, 1971
110.8 mln
+16.15 mln
17.06%
jan 1, 1972
116.55 mln
+5.75 mln
5.19%
jan 1, 1973
129.1 mln
+12.55 mln
10.77%
jan 1, 1974
133.75 mln
+4.65 mln
3.6%
jan 1, 1975
136.05 mln
+2.3 mln
1.72%
jan 1, 1976
188.55 mln
+52.5 mln
38.59%
jan 1, 1977
217.4 mln
+28.85 mln
15.3%
jan 1, 1978
270.9 mln
+53.5 mln
24.61%
jan 1, 1979
327.35 mln
+56.45 mln
20.84%
jan 1, 1980
347.2 mln
+19.85 mln
6.06%
jan 1, 1981
348.9 mln
+1.7 mln
0.49%
jan 1, 1982
396.7 mln
+47.8 mln
13.7%
jan 1, 1983
451.2 mln
+54.5 mln
13.74%
jan 1, 1984
465.15 mln
+13.95 mln
3.09%
jan 1, 1985
447.55 mln
-17.6 mln
-3.78%
jan 1, 1986
474.8 mln
+27.25 mln
6.09%
jan 1, 1987
503.45 mln
+28.65 mln
6.03%
jan 1, 1988
580.0 mln
+76.55 mln
15.21%
jan 1, 1989
651.9 mln
+71.9 mln
12.4%
jan 1, 1990
312.34 mln
-339.56 mln
-52.09%
jan 1, 1991
242.0 mln
-70.34 mln
-22.52%
jan 1, 1992
323.4 mln
+81.4 mln
33.64%
jan 1, 1993
287.533 mln
-35.867 mln
-11.09%
jan 1, 1994
271.618 mln
-15.916 mln
-5.54%
jan 1, 1995
316.948 mln
+45.33 mln
16.69%
jan 1, 1996
343.294 mln
+26.346 mln
8.31%
jan 1, 1997
425.559 mln
+82.264 mln
23.96%
jan 1, 1998
504.957 mln
+79.399 mln
18.66%
jan 1, 1999
644.95 mln
+139.993 mln
27.72%
jan 1, 2000
506.03 mln
-138.92 mln
-21.54%
jan 1, 2001
517.077 mln
+11.047 mln
2.18%
jan 1, 2002
430.902 mln
-86.175 mln
-16.67%
jan 1, 2003
611.246 mln
+180.344 mln
41.85%
jan 1, 2004
712.924 mln
+101.679 mln
16.63%
jan 1, 2005
805.032 mln
+92.108 mln
12.92%
jan 1, 2006
932.752 mln
+127.72 mln
15.87%
jan 1, 2007
1.183 bln
+250.321 mln
26.84%
jan 1, 2008
1.303 bln
+120.023 mln
10.14%
jan 1, 2009
1.547 bln
+244.08 mln
18.73%
jan 1, 2010
1.834 bln
+286.703 mln
18.53%
jan 1, 2011
2.09 bln
+256.162 mln
13.97%
jan 1, 2012
2.062 bln
-28.23 mln
-1.35%
jan 1, 2013
2.357 bln
+294.855 mln
14.3%
jan 1, 2014
2.603 bln
+246.061 mln
10.44%
jan 1, 2015
2.735 bln
+132.121 mln
5.08%
jan 1, 2016
2.777 bln
+41.919 mln
1.53%
Ranking of countries by current statistics by years


Comments: