29
/
en
AIzaSyAYiBZKx7MnpbEhh9jyipgxe19OcubqV5w
April 1, 2024
267403
Trinidad and Tobago
TTO
true
2
1
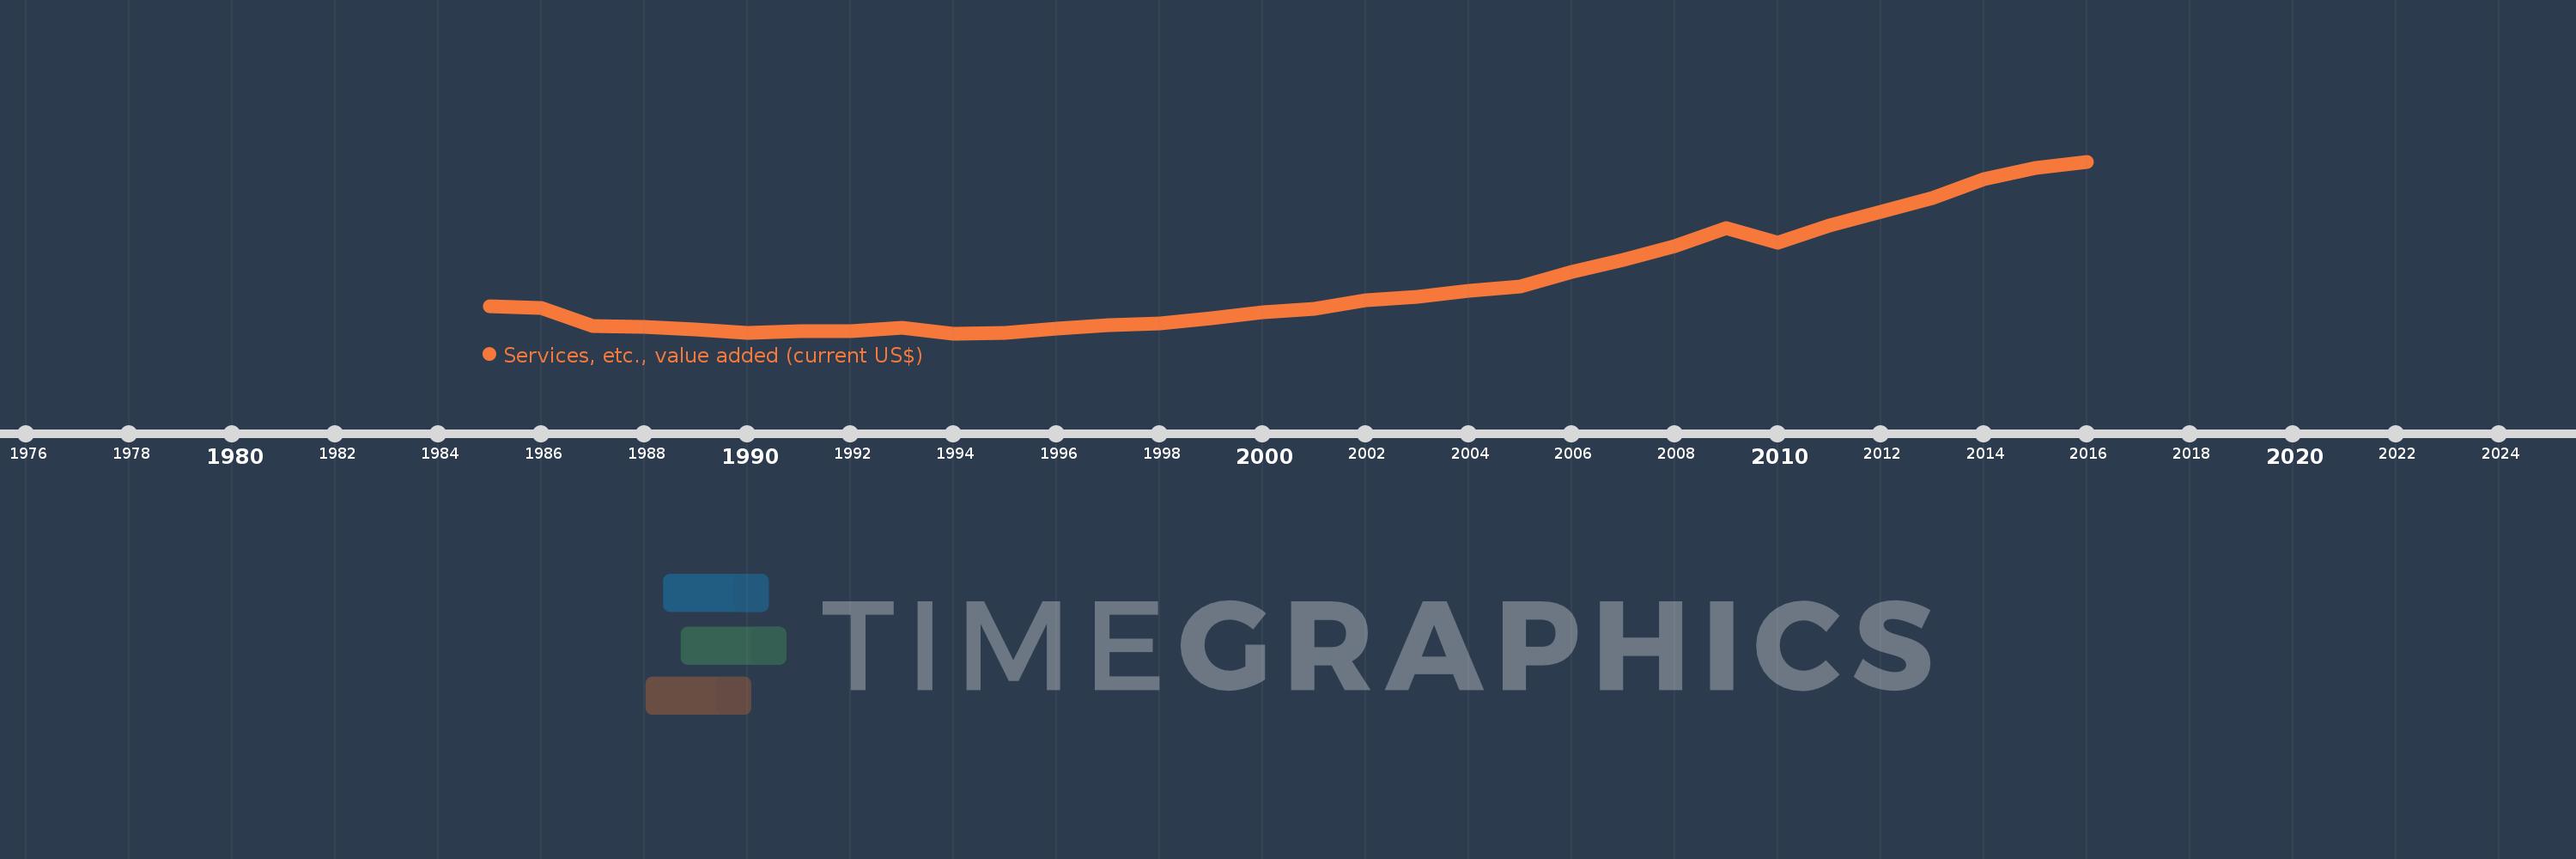
Services, etc., value added (current US$)
2016,2015,2014,2013,2012,2011,2010,2009,2008,2007,2006,2005,2004,2003,2002,2001,2000,1999,1998,1997,1996,1995,1994,1993,1992,1991,1990,1989,1988,1987,1986,1985
This statistics in other country:
AfghanistanAlbaniaAlgeriaAndorraAngolaAntigua and BarbudaArab WorldArgentinaArmeniaArubaAustraliaAustriaAzerbaijanBahamas, TheBahrainBangladeshBarbadosBelarusBelgiumBelizeBeninBermudaBhutanBoliviaBosnia and HerzegovinaBotswanaBrazilBrunei DarussalamBulgariaBurkina FasoBurundiCabo VerdeCambodiaCameroonCanadaCaribbean small statesCentral African RepublicCentral Europe and the BalticsChadChileChinaColombiaComorosCongo, Dem. Rep.Congo, Rep.Costa RicaCote d'IvoireCroatiaCubaCyprusCzech RepublicDenmarkDjiboutiDominicaDominican RepublicEarly-demographic dividendEast Asia & PacificEast Asia & Pacific (excluding high income)East Asia & Pacific (IDA & IBRD countries)EcuadorEgypt, Arab Rep.El SalvadorEquatorial GuineaEritreaEstoniaEthiopiaEuro areaEurope & Central AsiaEurope & Central Asia (excluding high income)Europe & Central Asia (IDA & IBRD countries)European UnionFaroe IslandsFijiFinlandFragile and conflict affected situationsFranceGabonGambia, TheGeorgiaGermanyGhanaGreeceGrenadaGuatemalaGuineaGuinea-BissauGuyanaHeavily indebted poor countries (HIPC)High incomeHondurasHong Kong SAR, ChinaHungaryIBRD onlyIcelandIDA & IBRD totalIDA blendIDA onlyIDA totalIndiaIndonesiaIran, Islamic Rep.IraqIrelandItalyJamaicaJapanJordanKazakhstanKenyaKiribatiKorea, Rep.KosovoKuwaitKyrgyz RepublicLao PDRLate-demographic dividendLatin America & Caribbean Latin America & Caribbean (excluding high income)Latin America & the Caribbean (IDA & IBRD countries)LatviaLeast developed countries: UN classificationLebanonLesothoLiberiaLibyaLithuaniaLow & middle incomeLow incomeLower middle incomeLuxembourgMacao SAR, ChinaMacedonia, FYRMadagascarMalawiMalaysiaMaldivesMaliMaltaMarshall IslandsMauritaniaMauritiusMexicoMicronesia, Fed. Sts.Middle East & North AfricaMiddle East & North Africa (excluding high income)Middle East & North Africa (IDA & IBRD countries)Middle incomeMoldovaMongoliaMontenegroMoroccoMozambiqueMyanmarNamibiaNepalNetherlandsNew CaledoniaNew ZealandNicaraguaNigerNigeriaNorth AmericaNorwayOECD membersOmanOther small statesPacific island small statesPakistanPalauPanamaPapua New GuineaParaguayPeruPhilippinesPolandPortugalPost-demographic dividendPre-demographic dividendPuerto RicoQatarRomaniaRussian FederationRwandaSamoaSao Tome and PrincipeSaudi ArabiaSenegalSerbiaSeychellesSierra LeoneSingaporeSlovak RepublicSloveniaSmall statesSolomon IslandsSouth AfricaSouth AsiaSouth Asia (IDA & IBRD)SpainSri LankaSt. Kitts and NevisSt. LuciaSt. Vincent and the GrenadinesSub-Saharan Africa Sub-Saharan Africa (excluding high income)Sub-Saharan Africa (IDA & IBRD countries)SudanSurinameSwazilandSwedenSwitzerlandSyrian Arab RepublicTajikistanTanzaniaThailandTimor-LesteTogoTongaTrinidad and TobagoTunisiaTurkeyTurkmenistanTuvaluUgandaUkraineUnited Arab EmiratesUnited KingdomUnited StatesUpper middle incomeUruguayUzbekistanVanuatuVenezuela, RBVietnamWest Bank and GazaWorldYemen, Rep.ZambiaZimbabwe Timeline:
This timeline shows a graph from 1985 to 2016 of Trinidad and Tobago. No data until 1984. Number of actual observations by date: 32.
Source name:
World Development Indicators
Source organization:
World Bank national accounts data, and OECD National Accounts data files.
Categories, topics:
Economy & Growth
Last updated:
apr 23, 2017
Indicators value changes by year
Minimum:
2.291 bln
jan 1, 1994
Maximum:
13.211 bln
jan 1, 2016
At the date of observation
Value
Absolute change
Change from previous value
jan 1, 1985
4.036 bln
+4.036 bln
0.0%
jan 1, 1986
3.916 bln
-119.667 mln
-2.97%
jan 1, 1987
2.778 bln
-1.138 bln
-29.05%
jan 1, 1988
2.675 bln
-103.0 mln
-3.71%
jan 1, 1989
2.552 bln
-123.744 mln
-4.63%
jan 1, 1990
2.323 bln
-228.954 mln
-8.97%
jan 1, 1991
2.435 bln
+112.258 mln
4.83%
jan 1, 1992
2.447 bln
+12.518 mln
0.51%
jan 1, 1993
2.63 bln
+182.447 mln
7.45%
jan 1, 1994
2.291 bln
-338.573 mln
-12.87%
jan 1, 1995
2.319 bln
+27.859 mln
1.22%
jan 1, 1996
2.584 bln
+264.903 mln
11.42%
jan 1, 1997
2.804 bln
+219.902 mln
8.51%
jan 1, 1998
2.901 bln
+97.101 mln
3.46%
jan 1, 1999
3.25 bln
+349.017 mln
12.03%
jan 1, 2000
3.602 bln
+351.949 mln
10.83%
jan 1, 2001
3.846 bln
+243.62 mln
6.76%
jan 1, 2002
4.372 bln
+526.724 mln
13.7%
jan 1, 2003
4.633 bln
+260.299 mln
5.95%
jan 1, 2004
5.001 bln
+368.151 mln
7.95%
jan 1, 2005
5.244 bln
+242.792 mln
4.86%
jan 1, 2006
6.191 bln
+947.566 mln
18.07%
jan 1, 2007
6.959 bln
+768.257 mln
12.41%
jan 1, 2008
7.809 bln
+849.266 mln
12.2%
jan 1, 2009
8.994 bln
+1.185 bln
15.18%
jan 1, 2010
8.058 bln
-935.713 mln
-10.4%
jan 1, 2011
9.137 bln
+1.079 bln
13.39%
jan 1, 2012
10.04 bln
+902.463 mln
9.88%
jan 1, 2013
10.882 bln
+842.29 mln
8.39%
jan 1, 2014
12.11 bln
+1.228 bln
11.28%
jan 1, 2015
12.776 bln
+666.145 mln
5.5%
jan 1, 2016
13.211 bln
+434.567 mln
3.4%
Ranking of countries by current statistics by years


Comments: