29
/
en
AIzaSyAYiBZKx7MnpbEhh9jyipgxe19OcubqV5w
April 1, 2024
286594
Zambia
ZMB
true
2
1
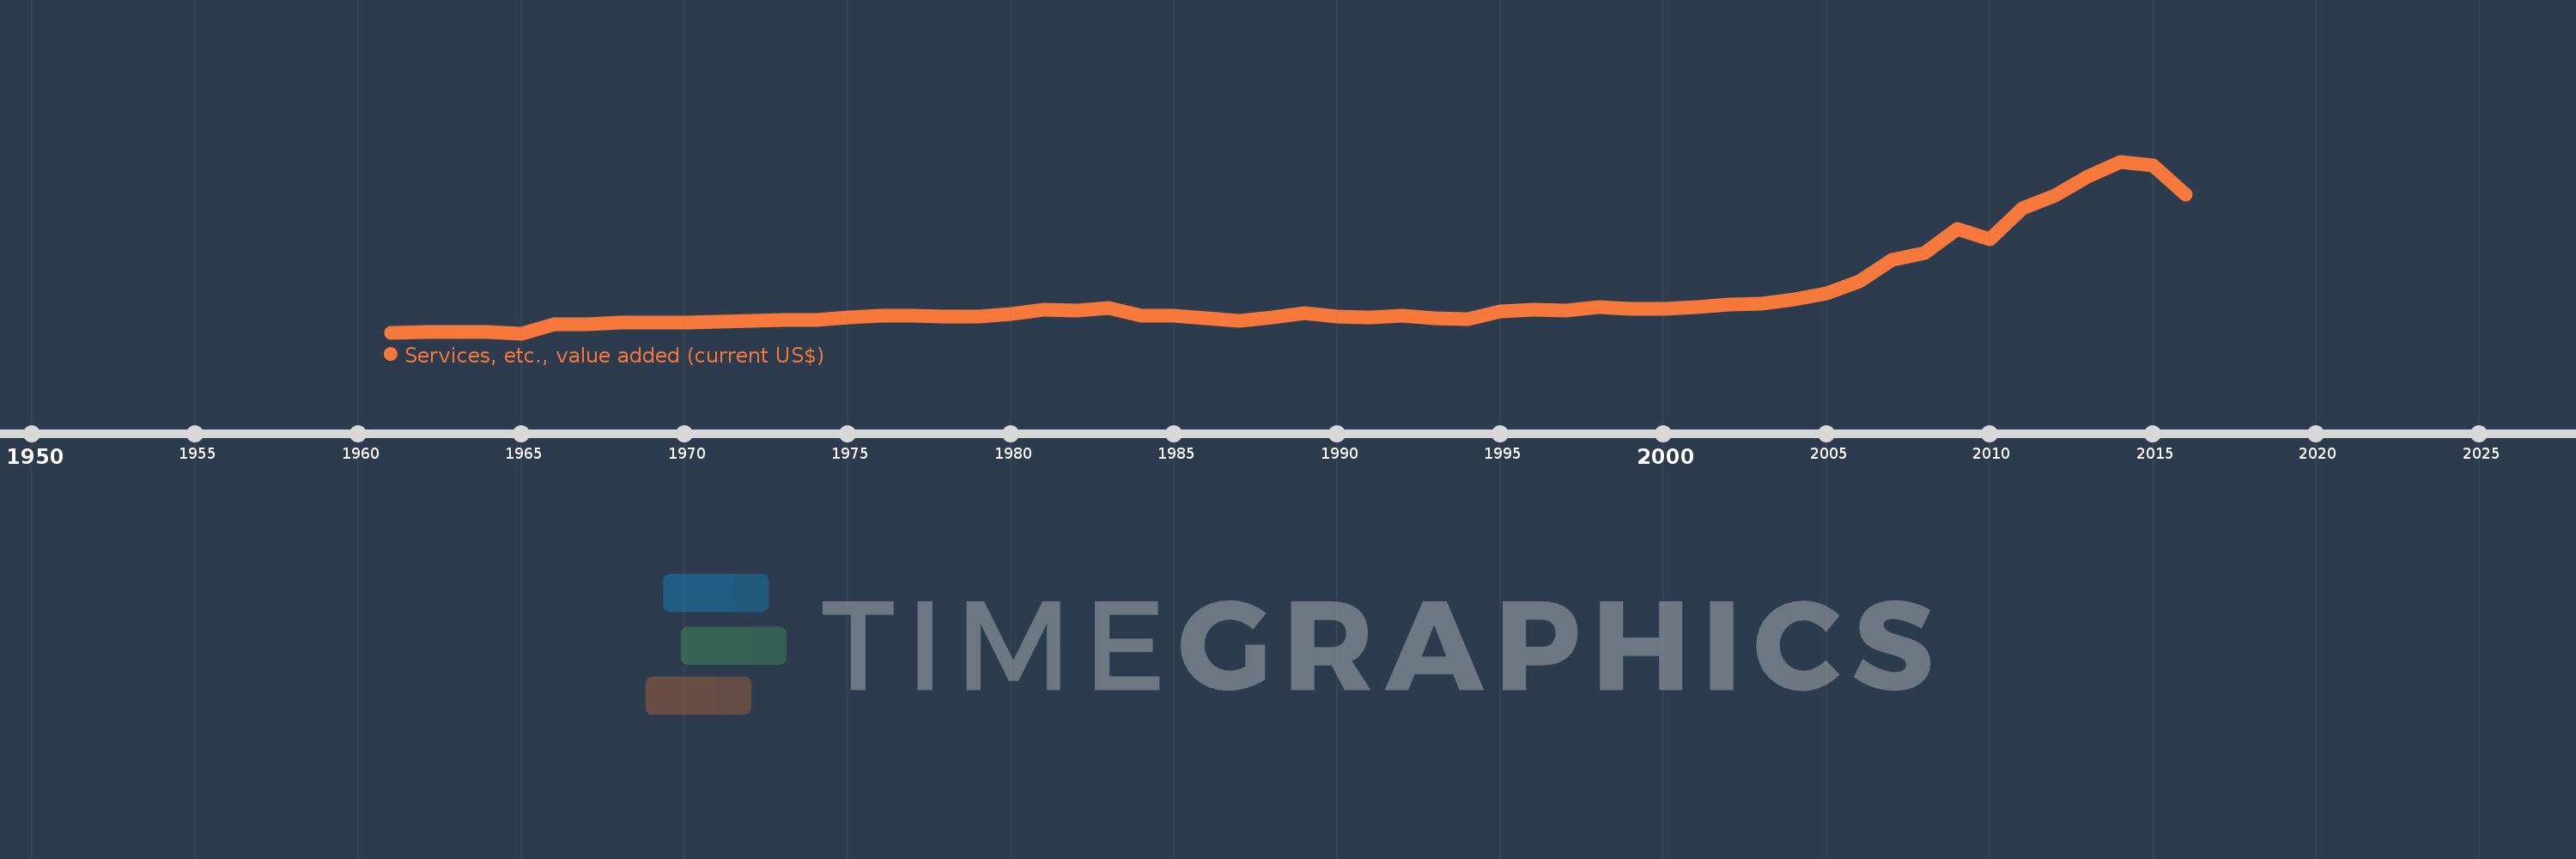
Services, etc., value added (current US$)
2016,2015,2014,2013,2012,2011,2010,2009,2008,2007,2006,2005,2004,2003,2002,2001,2000,1999,1998,1997,1996,1995,1994,1993,1992,1991,1990,1989,1988,1987,1986,1985,1984,1983,1982,1981,1980,1979,1978,1977,1976,1975,1974,1973,1972,1971,1970,1969,1968,1967,1966,1965,1964,1963,1962,1961
This statistics in other country:
AfghanistanAlbaniaAlgeriaAndorraAngolaAntigua and BarbudaArab WorldArgentinaArmeniaArubaAustraliaAustriaAzerbaijanBahamas, TheBahrainBangladeshBarbadosBelarusBelgiumBelizeBeninBermudaBhutanBoliviaBosnia and HerzegovinaBotswanaBrazilBrunei DarussalamBulgariaBurkina FasoBurundiCabo VerdeCambodiaCameroonCanadaCaribbean small statesCentral African RepublicCentral Europe and the BalticsChadChileChinaColombiaComorosCongo, Dem. Rep.Congo, Rep.Costa RicaCote d'IvoireCroatiaCubaCyprusCzech RepublicDenmarkDjiboutiDominicaDominican RepublicEarly-demographic dividendEast Asia & PacificEast Asia & Pacific (excluding high income)East Asia & Pacific (IDA & IBRD countries)EcuadorEgypt, Arab Rep.El SalvadorEquatorial GuineaEritreaEstoniaEthiopiaEuro areaEurope & Central AsiaEurope & Central Asia (excluding high income)Europe & Central Asia (IDA & IBRD countries)European UnionFaroe IslandsFijiFinlandFragile and conflict affected situationsFranceGabonGambia, TheGeorgiaGermanyGhanaGreeceGrenadaGuatemalaGuineaGuinea-BissauGuyanaHeavily indebted poor countries (HIPC)High incomeHondurasHong Kong SAR, ChinaHungaryIBRD onlyIcelandIDA & IBRD totalIDA blendIDA onlyIDA totalIndiaIndonesiaIran, Islamic Rep.IraqIrelandItalyJamaicaJapanJordanKazakhstanKenyaKiribatiKorea, Rep.KosovoKuwaitKyrgyz RepublicLao PDRLate-demographic dividendLatin America & Caribbean Latin America & Caribbean (excluding high income)Latin America & the Caribbean (IDA & IBRD countries)LatviaLeast developed countries: UN classificationLebanonLesothoLiberiaLibyaLithuaniaLow & middle incomeLow incomeLower middle incomeLuxembourgMacao SAR, ChinaMacedonia, FYRMadagascarMalawiMalaysiaMaldivesMaliMaltaMarshall IslandsMauritaniaMauritiusMexicoMicronesia, Fed. Sts.Middle East & North AfricaMiddle East & North Africa (excluding high income)Middle East & North Africa (IDA & IBRD countries)Middle incomeMoldovaMongoliaMontenegroMoroccoMozambiqueMyanmarNamibiaNepalNetherlandsNew CaledoniaNew ZealandNicaraguaNigerNigeriaNorth AmericaNorwayOECD membersOmanOther small statesPacific island small statesPakistanPalauPanamaPapua New GuineaParaguayPeruPhilippinesPolandPortugalPost-demographic dividendPre-demographic dividendPuerto RicoQatarRomaniaRussian FederationRwandaSamoaSao Tome and PrincipeSaudi ArabiaSenegalSerbiaSeychellesSierra LeoneSingaporeSlovak RepublicSloveniaSmall statesSolomon IslandsSouth AfricaSouth AsiaSouth Asia (IDA & IBRD)SpainSri LankaSt. Kitts and NevisSt. LuciaSt. Vincent and the GrenadinesSub-Saharan Africa Sub-Saharan Africa (excluding high income)Sub-Saharan Africa (IDA & IBRD countries)SudanSurinameSwazilandSwedenSwitzerlandSyrian Arab RepublicTajikistanTanzaniaThailandTimor-LesteTogoTongaTrinidad and TobagoTunisiaTurkeyTurkmenistanTuvaluUgandaUkraineUnited Arab EmiratesUnited KingdomUnited StatesUpper middle incomeUruguayUzbekistanVanuatuVenezuela, RBVietnamWest Bank and GazaWorldYemen, Rep.ZambiaZimbabwe Timeline:
This timeline shows a graph from 1961 to 2016 of Zambia. No data until 1960. Number of actual observations by date: 56.
Source name:
World Development Indicators
Source organization:
World Bank national accounts data, and OECD National Accounts data files.
Categories, topics:
Economy & Growth
Last updated:
apr 23, 2017
Indicators value changes by year
Minimum:
-588.571 mln
jan 1, 1965
Maximum:
14.889 bln
jan 1, 2014
At the date of observation
Value
Absolute change
Change from previous value
jan 1, 1961
-524.857 mln
-524.857 mln
0.0%
jan 1, 1962
-502.571 mln
+22.286 mln
-4.25%
jan 1, 1963
-487.857 mln
+14.714 mln
-2.93%
jan 1, 1964
-508.571 mln
-20.714 mln
4.25%
jan 1, 1965
-588.571 mln
-80.0 mln
15.73%
jan 1, 1966
253.714 mln
+842.286 mln
-143.11%
jan 1, 1967
243.143 mln
-10.571 mln
-4.17%
jan 1, 1968
363.857 mln
+120.714 mln
49.65%
jan 1, 1969
410.429 mln
+46.571 mln
12.8%
jan 1, 1970
383.286 mln
-27.143 mln
-6.61%
jan 1, 1971
478.143 mln
+94.857 mln
24.75%
jan 1, 1972
545.0 mln
+66.857 mln
13.98%
jan 1, 1973
595.0 mln
+50.0 mln
9.17%
jan 1, 1974
604.143 mln
+9.143 mln
1.54%
jan 1, 1975
815.667 mln
+211.524 mln
35.01%
jan 1, 1976
963.833 mln
+148.167 mln
18.17%
jan 1, 1977
1.01 bln
+46.167 mln
4.79%
jan 1, 1978
903.75 mln
-106.25 mln
-10.52%
jan 1, 1979
944.0 mln
+40.25 mln
4.45%
jan 1, 1980
1.136 bln
+192.375 mln
20.38%
jan 1, 1981
1.52 bln
+384.0 mln
33.79%
jan 1, 1982
1.443 bln
-76.931 mln
-5.06%
jan 1, 1983
1.663 bln
+220.0 mln
15.24%
jan 1, 1984
985.0 mln
-678.444 mln
-40.79%
jan 1, 1985
962.111 mln
-22.889 mln
-2.32%
jan 1, 1986
790.935 mln
-171.176 mln
-17.79%
jan 1, 1987
552.103 mln
-238.833 mln
-30.2%
jan 1, 1988
869.821 mln
+317.718 mln
57.55%
jan 1, 1989
1.251 bln
+381.637 mln
43.88%
jan 1, 1990
946.529 mln
-304.929 mln
-24.37%
jan 1, 1991
816.206 mln
-130.323 mln
-13.77%
jan 1, 1992
967.817 mln
+151.612 mln
18.58%
jan 1, 1993
773.559 mln
-194.259 mln
-20.07%
jan 1, 1994
702.268 mln
-71.291 mln
-9.22%
jan 1, 1995
1.391 bln
+689.01 mln
98.11%
jan 1, 1996
1.51 bln
+118.32 mln
8.5%
jan 1, 1997
1.494 bln
-15.185 mln
-1.01%
jan 1, 1998
1.785 bln
+290.238 mln
19.42%
jan 1, 1999
1.587 bln
-198.147 mln
-11.1%
jan 1, 2000
1.617 bln
+30.63 mln
1.93%
jan 1, 2001
1.763 bln
+145.744 mln
9.01%
jan 1, 2002
2.01 bln
+247.486 mln
14.04%
jan 1, 2003
2.085 bln
+74.999 mln
3.73%
jan 1, 2004
2.437 bln
+351.861 mln
16.87%
jan 1, 2005
3.037 bln
+599.28 mln
24.59%
jan 1, 2006
4.079 bln
+1.043 bln
34.33%
jan 1, 2007
6.061 bln
+1.982 bln
48.6%
jan 1, 2008
6.671 bln
+609.202 mln
10.05%
jan 1, 2009
8.782 bln
+2.111 bln
31.65%
jan 1, 2010
7.902 bln
-879.198 mln
-10.01%
jan 1, 2011
10.702 bln
+2.799 bln
35.42%
jan 1, 2012
11.821 bln
+1.119 bln
10.46%
jan 1, 2013
13.566 bln
+1.746 bln
14.77%
jan 1, 2014
14.889 bln
+1.323 bln
9.75%
jan 1, 2015
14.529 bln
-360.159 mln
-2.42%
jan 1, 2016
11.927 bln
-2.602 bln
-17.91%
Ranking of countries by current statistics by years


Comments: