29
/
en
AIzaSyAYiBZKx7MnpbEhh9jyipgxe19OcubqV5w
April 1, 2024
222921
Peru
PER
true
2
1
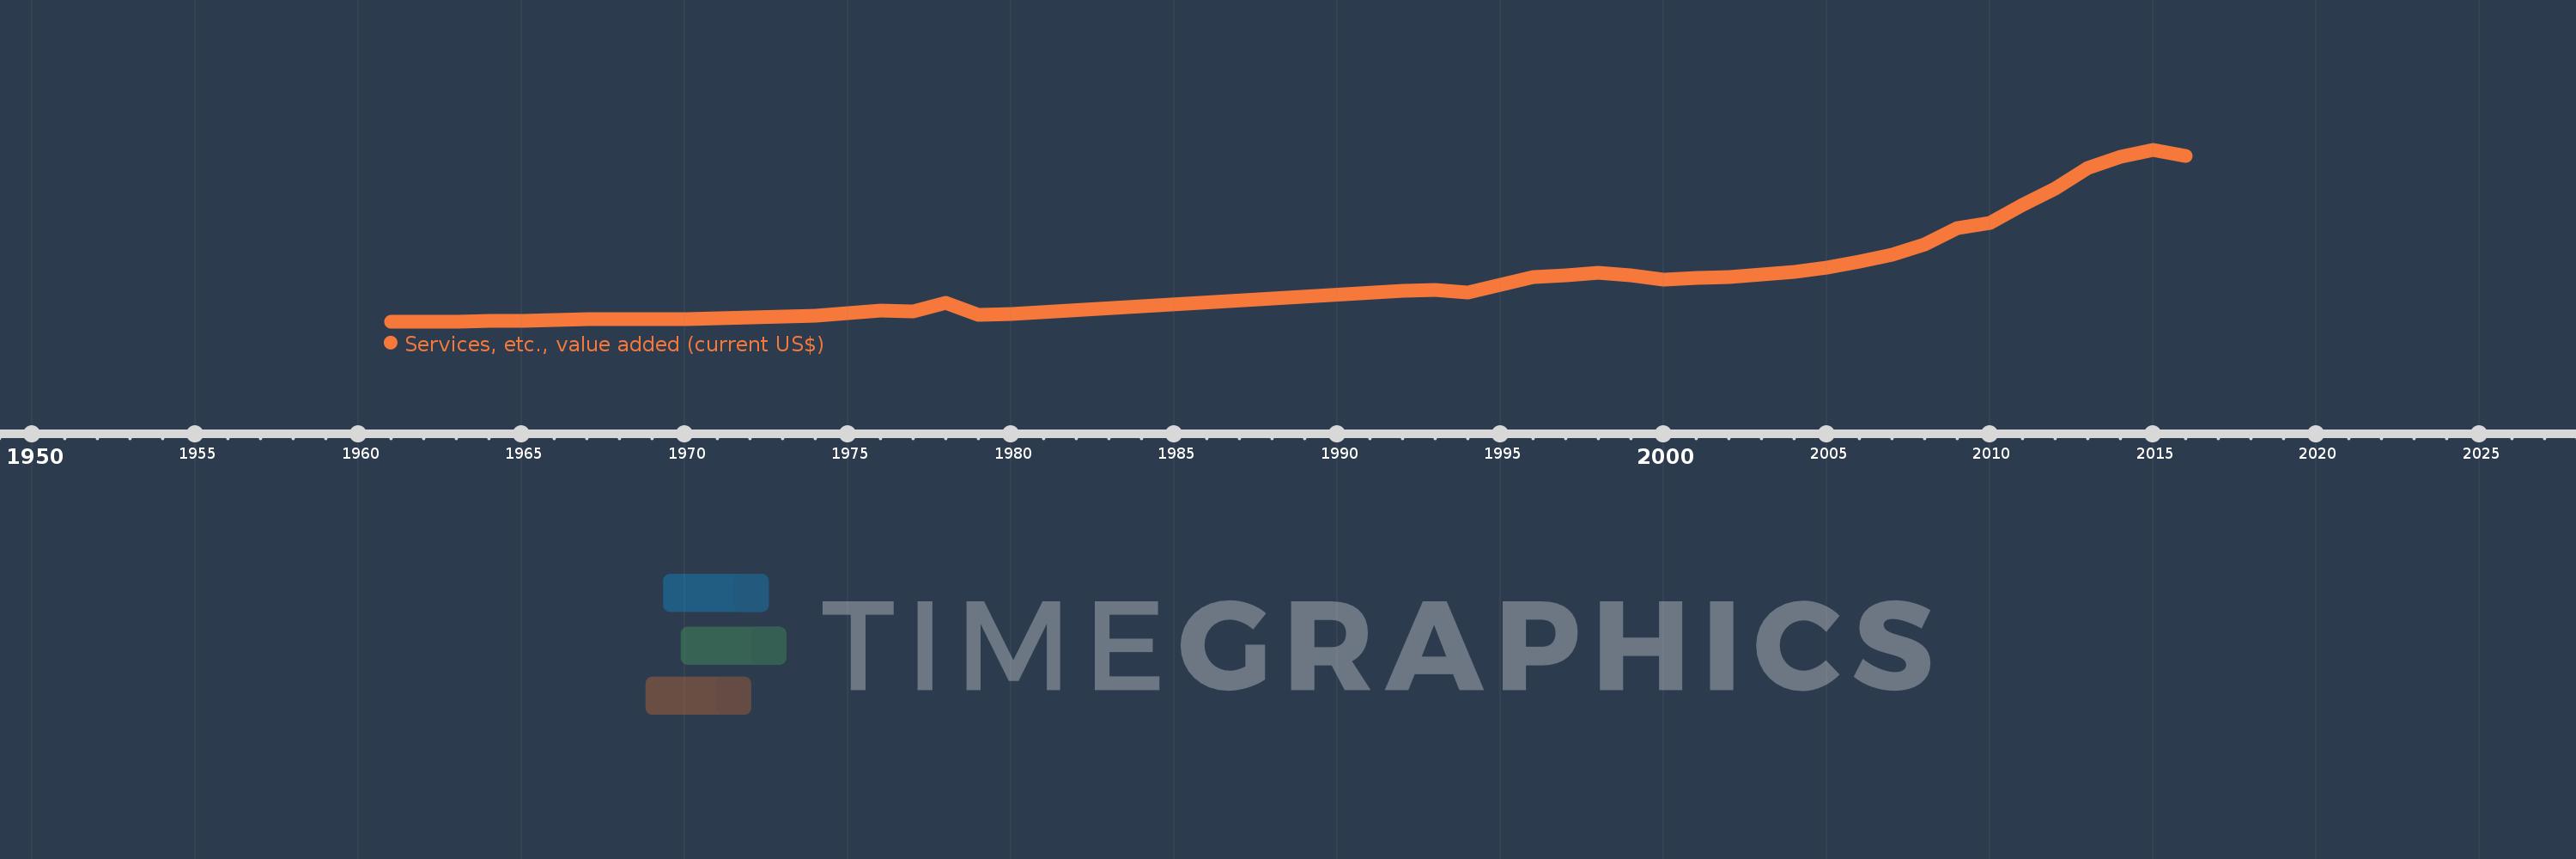
Services, etc., value added (current US$)
2016,2015,2014,2013,2012,2011,2010,2009,2008,2007,2006,2005,2004,2003,2002,2001,2000,1999,1998,1997,1996,1995,1994,1993,1992,1980,1979,1978,1977,1976,1975,1974,1973,1972,1971,1970,1969,1968,1967,1966,1965,1964,1963,1962,1961
This statistics in other country:
AfghanistanAlbaniaAlgeriaAndorraAngolaAntigua and BarbudaArab WorldArgentinaArmeniaArubaAustraliaAustriaAzerbaijanBahamas, TheBahrainBangladeshBarbadosBelarusBelgiumBelizeBeninBermudaBhutanBoliviaBosnia and HerzegovinaBotswanaBrazilBrunei DarussalamBulgariaBurkina FasoBurundiCabo VerdeCambodiaCameroonCanadaCaribbean small statesCentral African RepublicCentral Europe and the BalticsChadChileChinaColombiaComorosCongo, Dem. Rep.Congo, Rep.Costa RicaCote d'IvoireCroatiaCubaCyprusCzech RepublicDenmarkDjiboutiDominicaDominican RepublicEarly-demographic dividendEast Asia & PacificEast Asia & Pacific (excluding high income)East Asia & Pacific (IDA & IBRD countries)EcuadorEgypt, Arab Rep.El SalvadorEquatorial GuineaEritreaEstoniaEthiopiaEuro areaEurope & Central AsiaEurope & Central Asia (excluding high income)Europe & Central Asia (IDA & IBRD countries)European UnionFaroe IslandsFijiFinlandFragile and conflict affected situationsFranceGabonGambia, TheGeorgiaGermanyGhanaGreeceGrenadaGuatemalaGuineaGuinea-BissauGuyanaHeavily indebted poor countries (HIPC)High incomeHondurasHong Kong SAR, ChinaHungaryIBRD onlyIcelandIDA & IBRD totalIDA blendIDA onlyIDA totalIndiaIndonesiaIran, Islamic Rep.IraqIrelandItalyJamaicaJapanJordanKazakhstanKenyaKiribatiKorea, Rep.KosovoKuwaitKyrgyz RepublicLao PDRLate-demographic dividendLatin America & Caribbean Latin America & Caribbean (excluding high income)Latin America & the Caribbean (IDA & IBRD countries)LatviaLeast developed countries: UN classificationLebanonLesothoLiberiaLibyaLithuaniaLow & middle incomeLow incomeLower middle incomeLuxembourgMacao SAR, ChinaMacedonia, FYRMadagascarMalawiMalaysiaMaldivesMaliMaltaMarshall IslandsMauritaniaMauritiusMexicoMicronesia, Fed. Sts.Middle East & North AfricaMiddle East & North Africa (excluding high income)Middle East & North Africa (IDA & IBRD countries)Middle incomeMoldovaMongoliaMontenegroMoroccoMozambiqueMyanmarNamibiaNepalNetherlandsNew CaledoniaNew ZealandNicaraguaNigerNigeriaNorth AmericaNorwayOECD membersOmanOther small statesPacific island small statesPakistanPalauPanamaPapua New GuineaParaguayPeruPhilippinesPolandPortugalPost-demographic dividendPre-demographic dividendPuerto RicoQatarRomaniaRussian FederationRwandaSamoaSao Tome and PrincipeSaudi ArabiaSenegalSerbiaSeychellesSierra LeoneSingaporeSlovak RepublicSloveniaSmall statesSolomon IslandsSouth AfricaSouth AsiaSouth Asia (IDA & IBRD)SpainSri LankaSt. Kitts and NevisSt. LuciaSt. Vincent and the GrenadinesSub-Saharan Africa Sub-Saharan Africa (excluding high income)Sub-Saharan Africa (IDA & IBRD countries)SudanSurinameSwazilandSwedenSwitzerlandSyrian Arab RepublicTajikistanTanzaniaThailandTimor-LesteTogoTongaTrinidad and TobagoTunisiaTurkeyTurkmenistanTuvaluUgandaUkraineUnited Arab EmiratesUnited KingdomUnited StatesUpper middle incomeUruguayUzbekistanVanuatuVenezuela, RBVietnamWest Bank and GazaWorldYemen, Rep.ZambiaZimbabwe Timeline:
This timeline shows a graph from 1961 to 2016 of Peru. No data until 1960. Number of actual observations by date: 45.
Source name:
World Development Indicators
Source organization:
World Bank national accounts data, and OECD National Accounts data files.
Categories, topics:
Economy & Growth
Last updated:
apr 23, 2017
Indicators value changes by year
Minimum:
1.14 bln
jan 1, 1961
Maximum:
105.46 bln
jan 1, 2015
At the date of observation
Value
Absolute change
Change from previous value
jan 1, 1961
1.14 bln
+1.14 bln
0.0%
jan 1, 1962
1.278 bln
+138.289 mln
12.13%
jan 1, 1963
1.486 bln
+208.218 mln
16.29%
jan 1, 1964
1.711 bln
+225.162 mln
15.15%
jan 1, 1965
2.035 bln
+323.784 mln
18.92%
jan 1, 1966
2.434 bln
+398.499 mln
19.58%
jan 1, 1967
2.847 bln
+413.514 mln
16.99%
jan 1, 1968
2.821 bln
-26.471 mln
-0.93%
jan 1, 1969
2.606 bln
-214.578 mln
-7.61%
jan 1, 1970
2.858 bln
+252.345 mln
9.68%
jan 1, 1971
3.309 bln
+450.577 mln
15.76%
jan 1, 1972
3.748 bln
+438.933 mln
13.27%
jan 1, 1973
4.203 bln
+454.795 mln
12.13%
jan 1, 1974
4.961 bln
+758.369 mln
18.04%
jan 1, 1975
6.286 bln
+1.325 bln
26.71%
jan 1, 1976
7.94 bln
+1.654 bln
26.32%
jan 1, 1977
7.352 bln
-588.844 mln
-7.42%
jan 1, 1978
12.972 bln
+5.62 bln
76.45%
jan 1, 1979
5.397 bln
-7.574 bln
-58.39%
jan 1, 1980
6.077 bln
+679.293 mln
12.59%
jan 1, 1992
20.049 bln
+13.972 bln
229.93%
jan 1, 1993
20.445 bln
+396.187 mln
1.98%
jan 1, 1994
19.095 bln
-1.35 bln
-6.6%
jan 1, 1995
23.649 bln
+4.554 bln
23.85%
jan 1, 1996
28.211 bln
+4.562 bln
19.29%
jan 1, 1997
29.329 bln
+1.118 bln
3.96%
jan 1, 1998
30.832 bln
+1.503 bln
5.13%
jan 1, 1999
29.705 bln
-1.127 bln
-3.66%
jan 1, 2000
27.103 bln
-2.602 bln
-8.76%
jan 1, 2001
27.956 bln
+853.714 mln
3.15%
jan 1, 2002
28.365 bln
+408.253 mln
1.46%
jan 1, 2003
29.849 bln
+1.484 bln
5.23%
jan 1, 2004
31.691 bln
+1.842 bln
6.17%
jan 1, 2005
34.311 bln
+2.62 bln
8.27%
jan 1, 2006
37.906 bln
+3.595 bln
10.48%
jan 1, 2007
42.032 bln
+4.126 bln
10.89%
jan 1, 2008
48.332 bln
+6.3 bln
14.99%
jan 1, 2009
58.302 bln
+9.97 bln
20.63%
jan 1, 2010
61.301 bln
+2.999 bln
5.14%
jan 1, 2011
72.188 bln
+10.887 bln
17.76%
jan 1, 2012
82.013 bln
+9.825 bln
13.61%
jan 1, 2013
94.626 bln
+12.613 bln
15.38%
jan 1, 2014
101.633 bln
+7.008 bln
7.41%
jan 1, 2015
105.46 bln
+3.827 bln
3.77%
jan 1, 2016
102.225 bln
-3.235 bln
-3.07%
Ranking of countries by current statistics by years


Comments: