29
/
en
AIzaSyAYiBZKx7MnpbEhh9jyipgxe19OcubqV5w
April 1, 2024
281681
Venezuela, RB
VEN
true
2
1
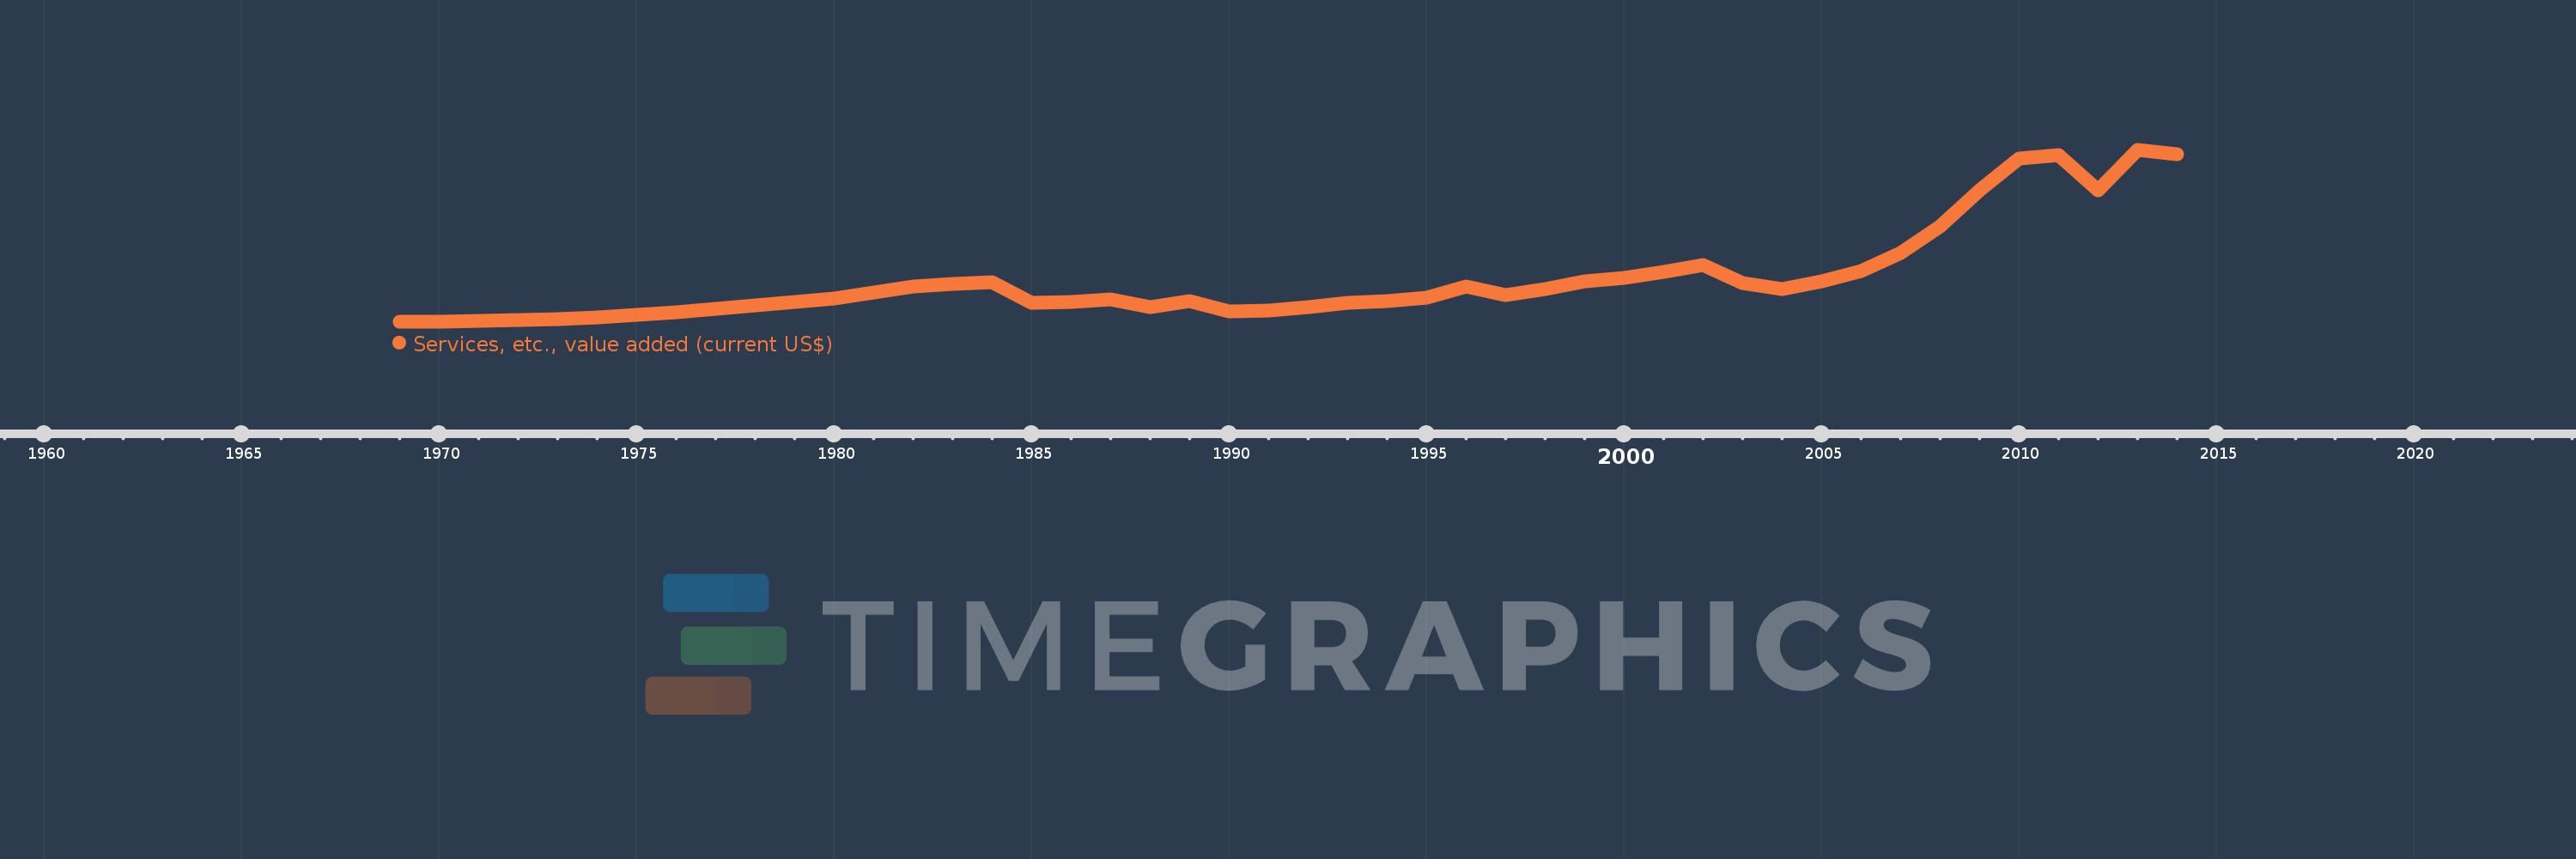
Services, etc., value added (current US$)
2014,2013,2012,2011,2010,2009,2008,2007,2006,2005,2004,2003,2002,2001,2000,1999,1998,1997,1996,1995,1994,1993,1992,1991,1990,1989,1988,1987,1986,1985,1984,1983,1982,1981,1980,1979,1978,1977,1976,1975,1974,1973,1972,1971,1970,1969
This statistics in other country:
AfghanistanAlbaniaAlgeriaAndorraAngolaAntigua and BarbudaArab WorldArgentinaArmeniaArubaAustraliaAustriaAzerbaijanBahamas, TheBahrainBangladeshBarbadosBelarusBelgiumBelizeBeninBermudaBhutanBoliviaBosnia and HerzegovinaBotswanaBrazilBrunei DarussalamBulgariaBurkina FasoBurundiCabo VerdeCambodiaCameroonCanadaCaribbean small statesCentral African RepublicCentral Europe and the BalticsChadChileChinaColombiaComorosCongo, Dem. Rep.Congo, Rep.Costa RicaCote d'IvoireCroatiaCubaCyprusCzech RepublicDenmarkDjiboutiDominicaDominican RepublicEarly-demographic dividendEast Asia & PacificEast Asia & Pacific (excluding high income)East Asia & Pacific (IDA & IBRD countries)EcuadorEgypt, Arab Rep.El SalvadorEquatorial GuineaEritreaEstoniaEthiopiaEuro areaEurope & Central AsiaEurope & Central Asia (excluding high income)Europe & Central Asia (IDA & IBRD countries)European UnionFaroe IslandsFijiFinlandFragile and conflict affected situationsFranceGabonGambia, TheGeorgiaGermanyGhanaGreeceGrenadaGuatemalaGuineaGuinea-BissauGuyanaHeavily indebted poor countries (HIPC)High incomeHondurasHong Kong SAR, ChinaHungaryIBRD onlyIcelandIDA & IBRD totalIDA blendIDA onlyIDA totalIndiaIndonesiaIran, Islamic Rep.IraqIrelandItalyJamaicaJapanJordanKazakhstanKenyaKiribatiKorea, Rep.KosovoKuwaitKyrgyz RepublicLao PDRLate-demographic dividendLatin America & Caribbean Latin America & Caribbean (excluding high income)Latin America & the Caribbean (IDA & IBRD countries)LatviaLeast developed countries: UN classificationLebanonLesothoLiberiaLibyaLithuaniaLow & middle incomeLow incomeLower middle incomeLuxembourgMacao SAR, ChinaMacedonia, FYRMadagascarMalawiMalaysiaMaldivesMaliMaltaMarshall IslandsMauritaniaMauritiusMexicoMicronesia, Fed. Sts.Middle East & North AfricaMiddle East & North Africa (excluding high income)Middle East & North Africa (IDA & IBRD countries)Middle incomeMoldovaMongoliaMontenegroMoroccoMozambiqueMyanmarNamibiaNepalNetherlandsNew CaledoniaNew ZealandNicaraguaNigerNigeriaNorth AmericaNorwayOECD membersOmanOther small statesPacific island small statesPakistanPalauPanamaPapua New GuineaParaguayPeruPhilippinesPolandPortugalPost-demographic dividendPre-demographic dividendPuerto RicoQatarRomaniaRussian FederationRwandaSamoaSao Tome and PrincipeSaudi ArabiaSenegalSerbiaSeychellesSierra LeoneSingaporeSlovak RepublicSloveniaSmall statesSolomon IslandsSouth AfricaSouth AsiaSouth Asia (IDA & IBRD)SpainSri LankaSt. Kitts and NevisSt. LuciaSt. Vincent and the GrenadinesSub-Saharan Africa Sub-Saharan Africa (excluding high income)Sub-Saharan Africa (IDA & IBRD countries)SudanSurinameSwazilandSwedenSwitzerlandSyrian Arab RepublicTajikistanTanzaniaThailandTimor-LesteTogoTongaTrinidad and TobagoTunisiaTurkeyTurkmenistanTuvaluUgandaUkraineUnited Arab EmiratesUnited KingdomUnited StatesUpper middle incomeUruguayUzbekistanVanuatuVenezuela, RBVietnamWest Bank and GazaWorldYemen, Rep.ZambiaZimbabwe Timeline:
This timeline shows a graph from 1969 to 2014 of Venezuela, RB. No data until 1968. Number of actual observations by date: 46.
Source name:
World Development Indicators
Source organization:
World Bank national accounts data, and OECD National Accounts data files.
Categories, topics:
Economy & Growth
Last updated:
apr 23, 2017
Indicators value changes by year
Minimum:
5.712 bln
jan 1, 1969
Maximum:
158.285 bln
jan 1, 2013
At the date of observation
Value
Absolute change
Change from previous value
jan 1, 1969
5.712 bln
+5.712 bln
0.0%
jan 1, 1970
6.225 bln
+512.889 mln
8.98%
jan 1, 1971
6.676 bln
+451.244 mln
7.25%
jan 1, 1972
7.572 bln
+896.204 mln
13.42%
jan 1, 1973
8.469 bln
+896.909 mln
11.84%
jan 1, 1974
9.724 bln
+1.255 bln
14.81%
jan 1, 1975
11.744 bln
+2.02 bln
20.78%
jan 1, 1976
14.688 bln
+2.944 bln
25.07%
jan 1, 1977
17.412 bln
+2.724 bln
18.54%
jan 1, 1978
20.743 bln
+3.332 bln
19.13%
jan 1, 1979
23.653 bln
+2.909 bln
14.03%
jan 1, 1980
26.536 bln
+2.884 bln
12.19%
jan 1, 1981
31.842 bln
+5.306 bln
19.99%
jan 1, 1982
37.254 bln
+5.412 bln
17.0%
jan 1, 1983
39.593 bln
+2.339 bln
6.28%
jan 1, 1984
41.246 bln
+1.653 bln
4.17%
jan 1, 1985
22.455 bln
-18.792 bln
-45.56%
jan 1, 1986
23.617 bln
+1.163 bln
5.18%
jan 1, 1987
25.601 bln
+1.984 bln
8.4%
jan 1, 1988
18.618 bln
-6.983 bln
-27.28%
jan 1, 1989
23.989 bln
+5.371 bln
28.85%
jan 1, 1990
14.924 bln
-9.065 bln
-37.79%
jan 1, 1991
15.743 bln
+819.118 mln
5.49%
jan 1, 1992
19.287 bln
+3.543 bln
22.51%
jan 1, 1993
22.975 bln
+3.688 bln
19.12%
jan 1, 1994
24.324 bln
+1.349 bln
5.87%
jan 1, 1995
27.424 bln
+3.1 bln
12.75%
jan 1, 1996
37.566 bln
+10.142 bln
36.98%
jan 1, 1997
29.783 bln
-7.783 bln
-20.72%
jan 1, 1998
34.633 bln
+4.85 bln
16.28%
jan 1, 1999
41.838 bln
+7.205 bln
20.8%
jan 1, 2000
44.852 bln
+3.014 bln
7.2%
jan 1, 2001
50.466 bln
+5.614 bln
12.52%
jan 1, 2002
56.507 bln
+6.041 bln
11.97%
jan 1, 2003
40.178 bln
-16.329 bln
-28.9%
jan 1, 2004
34.723 bln
-5.456 bln
-13.58%
jan 1, 2005
41.917 bln
+7.195 bln
20.72%
jan 1, 2006
51.032 bln
+9.114 bln
21.74%
jan 1, 2007
66.693 bln
+15.661 bln
30.69%
jan 1, 2008
90.654 bln
+23.961 bln
35.93%
jan 1, 2009
122.448 bln
+31.794 bln
35.07%
jan 1, 2010
151.246 bln
+28.799 bln
23.52%
jan 1, 2011
153.708 bln
+2.462 bln
1.63%
jan 1, 2012
122.278 bln
-31.43 bln
-20.45%
jan 1, 2013
158.285 bln
+36.007 bln
29.45%
jan 1, 2014
154.846 bln
-3.439 bln
-2.17%
Ranking of countries by current statistics by years


Comments: