29
/
en
AIzaSyAYiBZKx7MnpbEhh9jyipgxe19OcubqV5w
April 1, 2024
252487
St. Vincent and the Grenadines
VCT
true
2
1
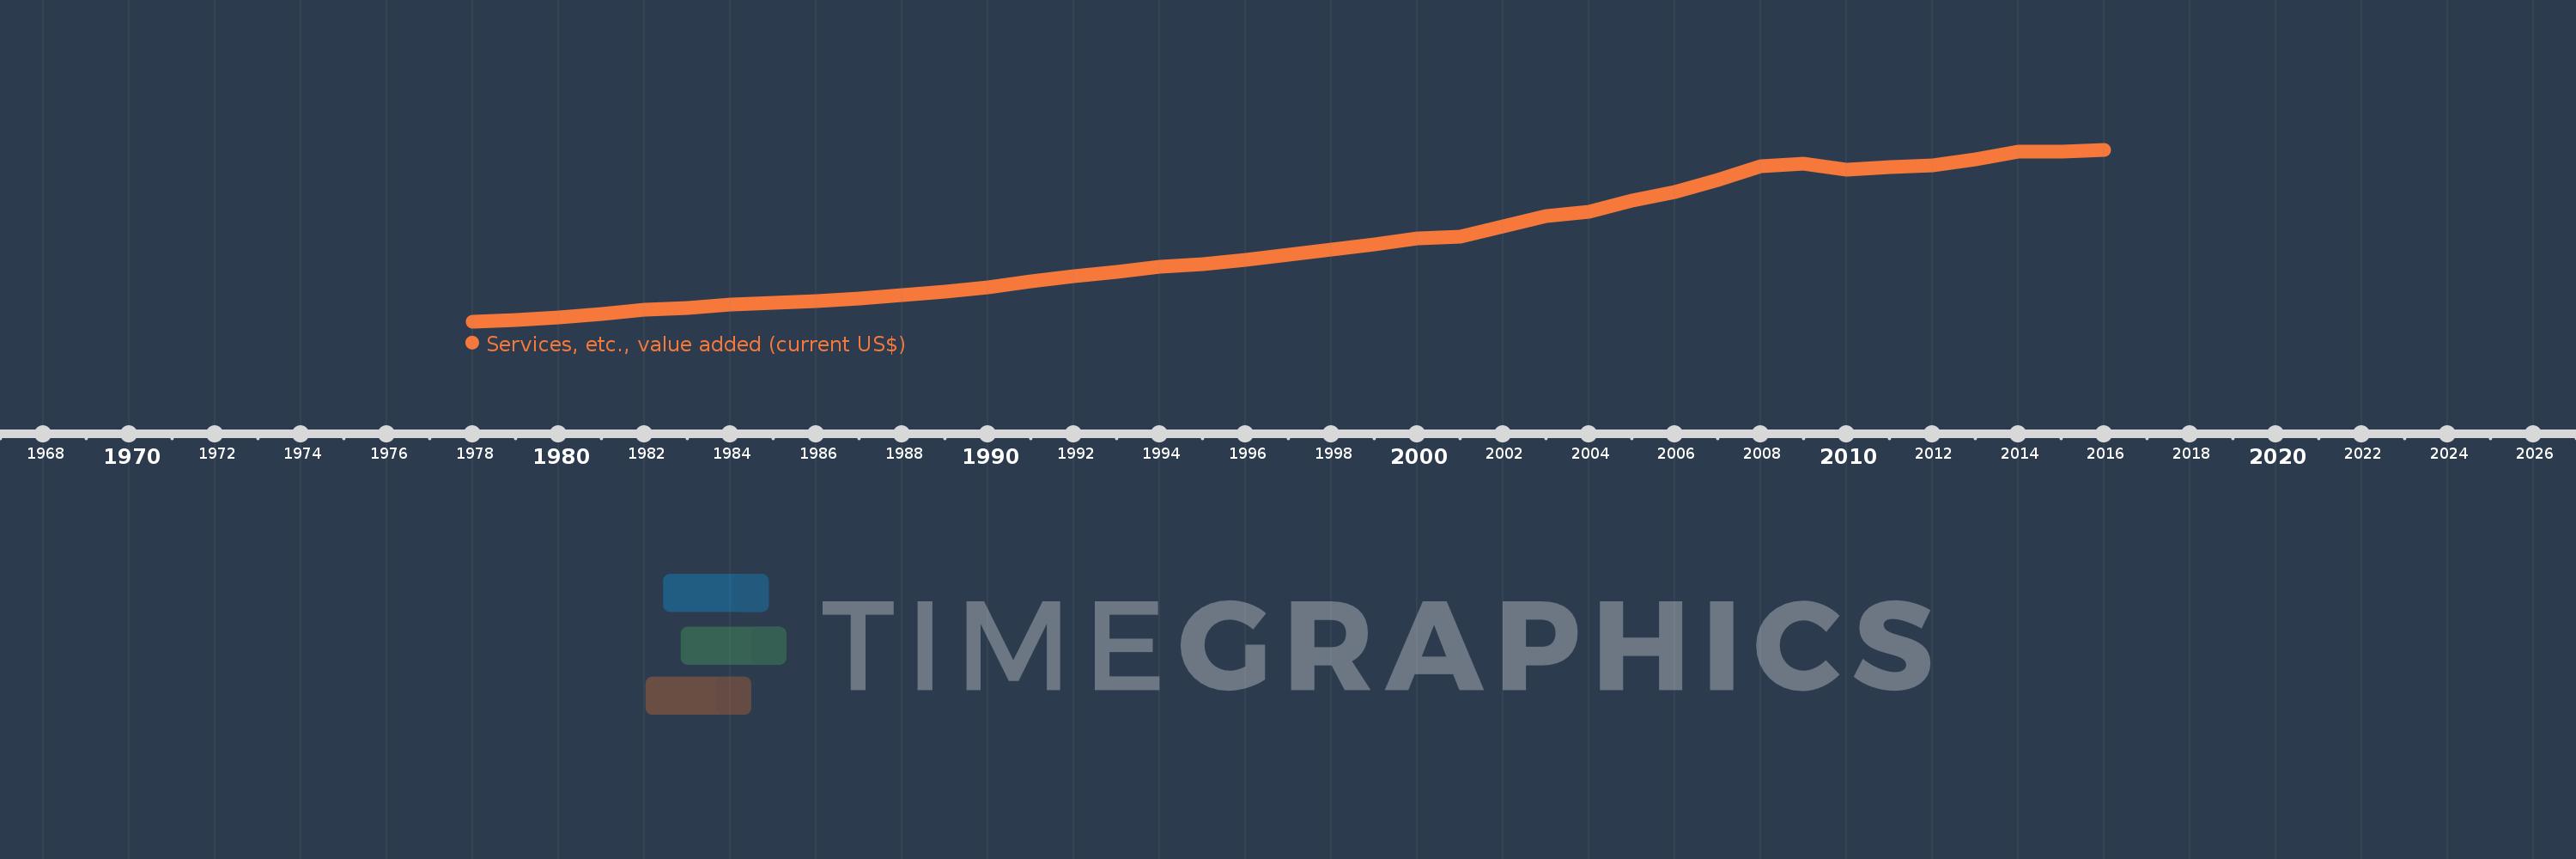
Services, etc., value added (current US$)
2016,2015,2014,2013,2012,2011,2010,2009,2008,2007,2006,2005,2004,2003,2002,2001,2000,1999,1998,1997,1996,1995,1994,1993,1992,1991,1990,1989,1988,1987,1986,1985,1984,1983,1982,1981,1980,1979,1978
This statistics in other country:
AfghanistanAlbaniaAlgeriaAndorraAngolaAntigua and BarbudaArab WorldArgentinaArmeniaArubaAustraliaAustriaAzerbaijanBahamas, TheBahrainBangladeshBarbadosBelarusBelgiumBelizeBeninBermudaBhutanBoliviaBosnia and HerzegovinaBotswanaBrazilBrunei DarussalamBulgariaBurkina FasoBurundiCabo VerdeCambodiaCameroonCanadaCaribbean small statesCentral African RepublicCentral Europe and the BalticsChadChileChinaColombiaComorosCongo, Dem. Rep.Congo, Rep.Costa RicaCote d'IvoireCroatiaCubaCyprusCzech RepublicDenmarkDjiboutiDominicaDominican RepublicEarly-demographic dividendEast Asia & PacificEast Asia & Pacific (excluding high income)East Asia & Pacific (IDA & IBRD countries)EcuadorEgypt, Arab Rep.El SalvadorEquatorial GuineaEritreaEstoniaEthiopiaEuro areaEurope & Central AsiaEurope & Central Asia (excluding high income)Europe & Central Asia (IDA & IBRD countries)European UnionFaroe IslandsFijiFinlandFragile and conflict affected situationsFranceGabonGambia, TheGeorgiaGermanyGhanaGreeceGrenadaGuatemalaGuineaGuinea-BissauGuyanaHeavily indebted poor countries (HIPC)High incomeHondurasHong Kong SAR, ChinaHungaryIBRD onlyIcelandIDA & IBRD totalIDA blendIDA onlyIDA totalIndiaIndonesiaIran, Islamic Rep.IraqIrelandItalyJamaicaJapanJordanKazakhstanKenyaKiribatiKorea, Rep.KosovoKuwaitKyrgyz RepublicLao PDRLate-demographic dividendLatin America & Caribbean Latin America & Caribbean (excluding high income)Latin America & the Caribbean (IDA & IBRD countries)LatviaLeast developed countries: UN classificationLebanonLesothoLiberiaLibyaLithuaniaLow & middle incomeLow incomeLower middle incomeLuxembourgMacao SAR, ChinaMacedonia, FYRMadagascarMalawiMalaysiaMaldivesMaliMaltaMarshall IslandsMauritaniaMauritiusMexicoMicronesia, Fed. Sts.Middle East & North AfricaMiddle East & North Africa (excluding high income)Middle East & North Africa (IDA & IBRD countries)Middle incomeMoldovaMongoliaMontenegroMoroccoMozambiqueMyanmarNamibiaNepalNetherlandsNew CaledoniaNew ZealandNicaraguaNigerNigeriaNorth AmericaNorwayOECD membersOmanOther small statesPacific island small statesPakistanPalauPanamaPapua New GuineaParaguayPeruPhilippinesPolandPortugalPost-demographic dividendPre-demographic dividendPuerto RicoQatarRomaniaRussian FederationRwandaSamoaSao Tome and PrincipeSaudi ArabiaSenegalSerbiaSeychellesSierra LeoneSingaporeSlovak RepublicSloveniaSmall statesSolomon IslandsSouth AfricaSouth AsiaSouth Asia (IDA & IBRD)SpainSri LankaSt. Kitts and NevisSt. LuciaSt. Vincent and the GrenadinesSub-Saharan Africa Sub-Saharan Africa (excluding high income)Sub-Saharan Africa (IDA & IBRD countries)SudanSurinameSwazilandSwedenSwitzerlandSyrian Arab RepublicTajikistanTanzaniaThailandTimor-LesteTogoTongaTrinidad and TobagoTunisiaTurkeyTurkmenistanTuvaluUgandaUkraineUnited Arab EmiratesUnited KingdomUnited StatesUpper middle incomeUruguayUzbekistanVanuatuVenezuela, RBVietnamWest Bank and GazaWorldYemen, Rep.ZambiaZimbabwe Timeline:
This timeline shows a graph from 1978 to 2016 of St. Vincent and the Grenadines. No data until 1977. Number of actual observations by date: 39.
Source name:
World Development Indicators
Source organization:
World Bank national accounts data, and OECD National Accounts data files.
Categories, topics:
Economy & Growth
Last updated:
apr 23, 2017
Indicators value changes by year
Minimum:
31.018 mln
jan 1, 1978
Maximum:
465.062 mln
jan 1, 2016
At the date of observation
Value
Absolute change
Change from previous value
jan 1, 1978
31.018 mln
+31.018 mln
0.0%
jan 1, 1979
36.252 mln
+5.234 mln
16.88%
jan 1, 1980
42.154 mln
+5.902 mln
16.28%
jan 1, 1981
51.126 mln
+8.973 mln
21.29%
jan 1, 1982
61.151 mln
+10.025 mln
19.61%
jan 1, 1983
67.336 mln
+6.185 mln
10.11%
jan 1, 1984
74.256 mln
+6.92 mln
10.28%
jan 1, 1985
79.017 mln
+4.761 mln
6.41%
jan 1, 1986
82.904 mln
+3.887 mln
4.92%
jan 1, 1987
89.612 mln
+6.708 mln
8.09%
jan 1, 1988
99.263 mln
+9.651 mln
10.77%
jan 1, 1989
107.176 mln
+7.913 mln
7.97%
jan 1, 1990
118.353 mln
+11.176 mln
10.43%
jan 1, 1991
134.383 mln
+16.031 mln
13.54%
jan 1, 1992
147.428 mln
+13.045 mln
9.71%
jan 1, 1993
157.953 mln
+10.525 mln
7.14%
jan 1, 1994
169.683 mln
+11.73 mln
7.43%
jan 1, 1995
178.023 mln
+8.341 mln
4.92%
jan 1, 1996
188.212 mln
+10.189 mln
5.72%
jan 1, 1997
201.38 mln
+13.167 mln
7.0%
jan 1, 1998
212.981 mln
+11.601 mln
5.76%
jan 1, 1999
226.862 mln
+13.881 mln
6.52%
jan 1, 2000
241.182 mln
+14.32 mln
6.31%
jan 1, 2001
246.196 mln
+5.014 mln
2.08%
jan 1, 2002
273.041 mln
+26.844 mln
10.9%
jan 1, 2003
297.943 mln
+24.902 mln
9.12%
jan 1, 2004
310.503 mln
+12.56 mln
4.22%
jan 1, 2005
336.937 mln
+26.434 mln
8.51%
jan 1, 2006
358.797 mln
+21.861 mln
6.49%
jan 1, 2007
390.652 mln
+31.855 mln
8.88%
jan 1, 2008
425.406 mln
+34.754 mln
8.9%
jan 1, 2009
431.124 mln
+5.718 mln
1.34%
jan 1, 2010
415.894 mln
-15.23 mln
-3.53%
jan 1, 2011
422.786 mln
+6.891 mln
1.66%
jan 1, 2012
427.142 mln
+4.356 mln
1.03%
jan 1, 2013
442.104 mln
+14.962 mln
3.5%
jan 1, 2014
460.521 mln
+18.417 mln
4.17%
jan 1, 2015
462.18 mln
+1.659 mln
0.36%
jan 1, 2016
465.062 mln
+2.882 mln
0.62%
Ranking of countries by current statistics by years


Comments: