29
/
en
AIzaSyAYiBZKx7MnpbEhh9jyipgxe19OcubqV5w
April 1, 2024
220231
Papua New Guinea
PNG
true
2
1
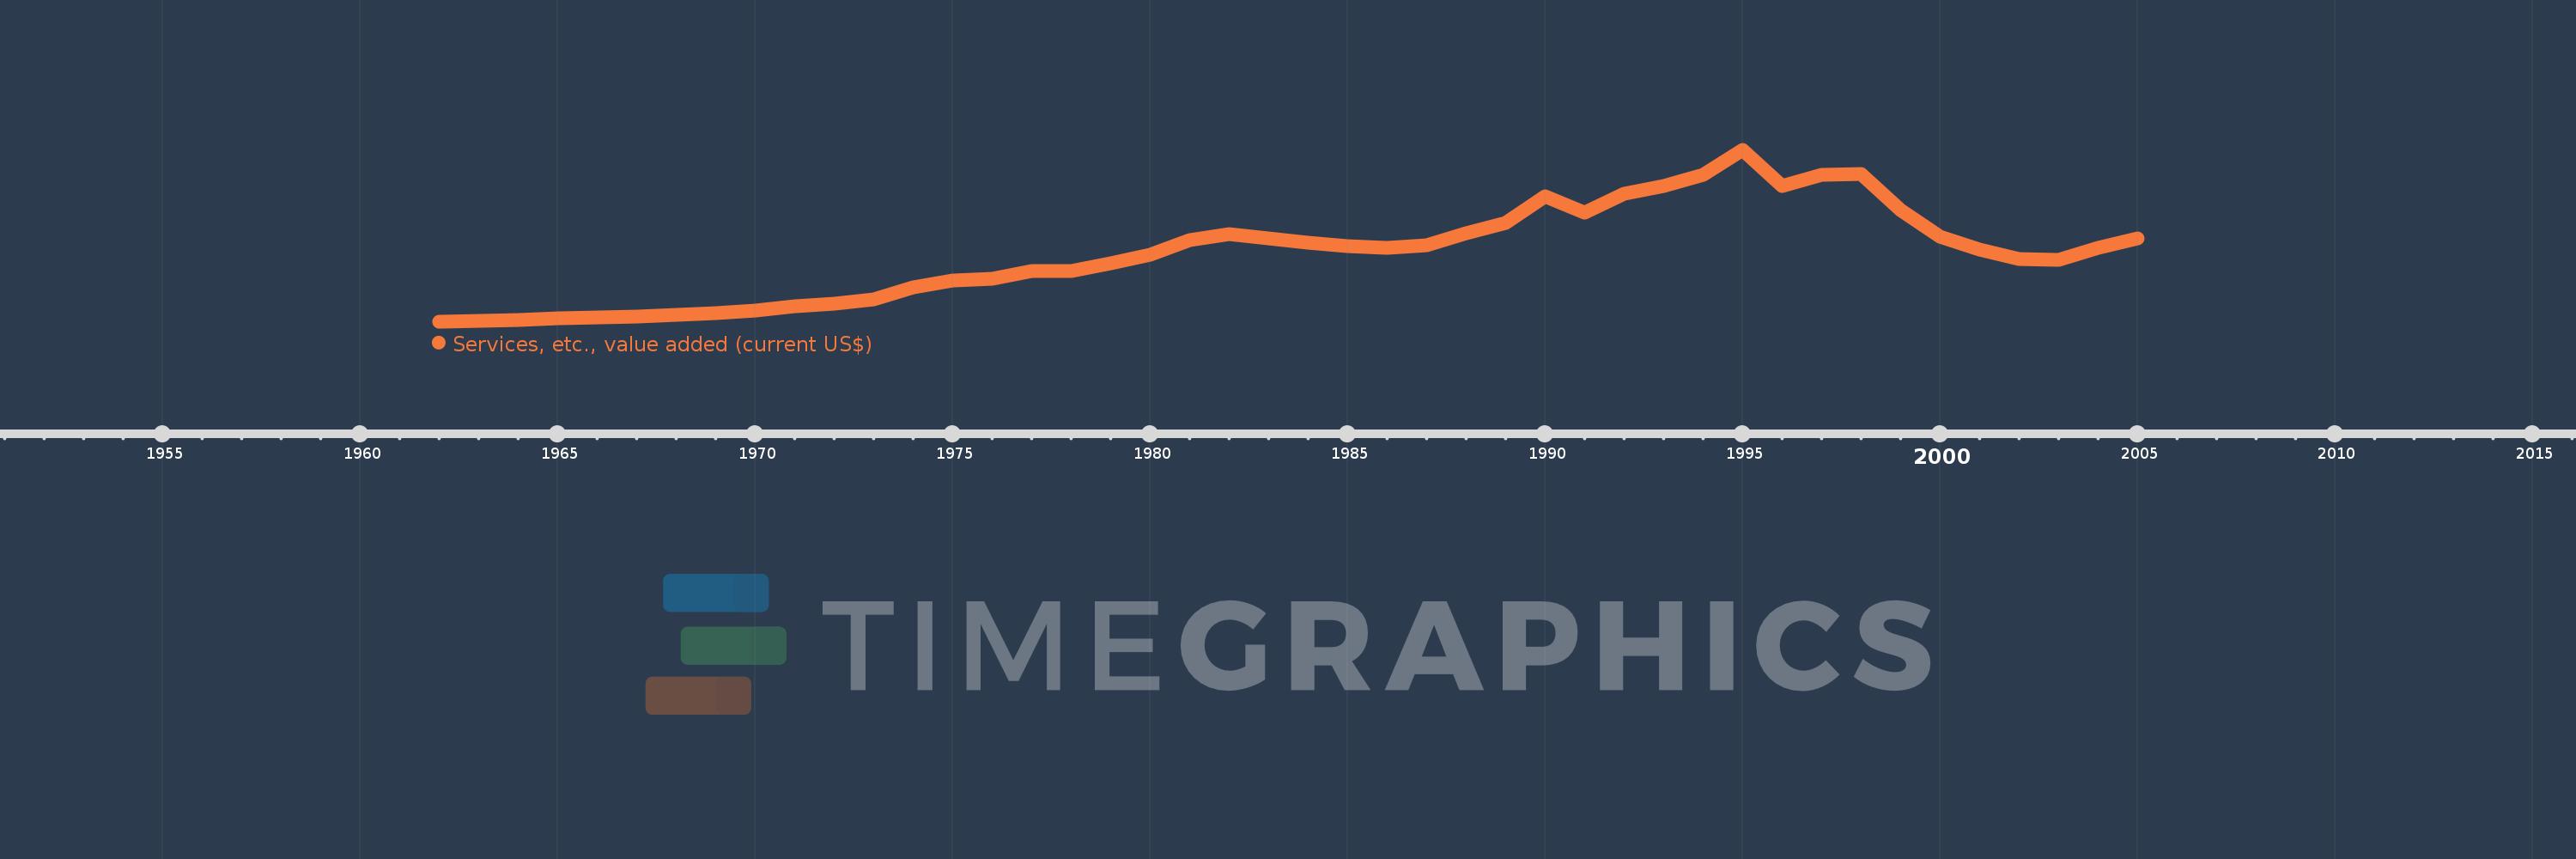
Services, etc., value added (current US$)
2005,2004,2003,2002,2001,2000,1999,1998,1997,1996,1995,1994,1993,1992,1991,1990,1989,1988,1987,1986,1985,1984,1983,1982,1981,1980,1979,1978,1977,1976,1975,1974,1973,1972,1971,1970,1969,1968,1967,1966,1965,1964,1963,1962
This statistics in other country:
AfghanistanAlbaniaAlgeriaAndorraAngolaAntigua and BarbudaArab WorldArgentinaArmeniaArubaAustraliaAustriaAzerbaijanBahamas, TheBahrainBangladeshBarbadosBelarusBelgiumBelizeBeninBermudaBhutanBoliviaBosnia and HerzegovinaBotswanaBrazilBrunei DarussalamBulgariaBurkina FasoBurundiCabo VerdeCambodiaCameroonCanadaCaribbean small statesCentral African RepublicCentral Europe and the BalticsChadChileChinaColombiaComorosCongo, Dem. Rep.Congo, Rep.Costa RicaCote d'IvoireCroatiaCubaCyprusCzech RepublicDenmarkDjiboutiDominicaDominican RepublicEarly-demographic dividendEast Asia & PacificEast Asia & Pacific (excluding high income)East Asia & Pacific (IDA & IBRD countries)EcuadorEgypt, Arab Rep.El SalvadorEquatorial GuineaEritreaEstoniaEthiopiaEuro areaEurope & Central AsiaEurope & Central Asia (excluding high income)Europe & Central Asia (IDA & IBRD countries)European UnionFaroe IslandsFijiFinlandFragile and conflict affected situationsFranceGabonGambia, TheGeorgiaGermanyGhanaGreeceGrenadaGuatemalaGuineaGuinea-BissauGuyanaHeavily indebted poor countries (HIPC)High incomeHondurasHong Kong SAR, ChinaHungaryIBRD onlyIcelandIDA & IBRD totalIDA blendIDA onlyIDA totalIndiaIndonesiaIran, Islamic Rep.IraqIrelandItalyJamaicaJapanJordanKazakhstanKenyaKiribatiKorea, Rep.KosovoKuwaitKyrgyz RepublicLao PDRLate-demographic dividendLatin America & Caribbean Latin America & Caribbean (excluding high income)Latin America & the Caribbean (IDA & IBRD countries)LatviaLeast developed countries: UN classificationLebanonLesothoLiberiaLibyaLithuaniaLow & middle incomeLow incomeLower middle incomeLuxembourgMacao SAR, ChinaMacedonia, FYRMadagascarMalawiMalaysiaMaldivesMaliMaltaMarshall IslandsMauritaniaMauritiusMexicoMicronesia, Fed. Sts.Middle East & North AfricaMiddle East & North Africa (excluding high income)Middle East & North Africa (IDA & IBRD countries)Middle incomeMoldovaMongoliaMontenegroMoroccoMozambiqueMyanmarNamibiaNepalNetherlandsNew CaledoniaNew ZealandNicaraguaNigerNigeriaNorth AmericaNorwayOECD membersOmanOther small statesPacific island small statesPakistanPalauPanamaPapua New GuineaParaguayPeruPhilippinesPolandPortugalPost-demographic dividendPre-demographic dividendPuerto RicoQatarRomaniaRussian FederationRwandaSamoaSao Tome and PrincipeSaudi ArabiaSenegalSerbiaSeychellesSierra LeoneSingaporeSlovak RepublicSloveniaSmall statesSolomon IslandsSouth AfricaSouth AsiaSouth Asia (IDA & IBRD)SpainSri LankaSt. Kitts and NevisSt. LuciaSt. Vincent and the GrenadinesSub-Saharan Africa Sub-Saharan Africa (excluding high income)Sub-Saharan Africa (IDA & IBRD countries)SudanSurinameSwazilandSwedenSwitzerlandSyrian Arab RepublicTajikistanTanzaniaThailandTimor-LesteTogoTongaTrinidad and TobagoTunisiaTurkeyTurkmenistanTuvaluUgandaUkraineUnited Arab EmiratesUnited KingdomUnited StatesUpper middle incomeUruguayUzbekistanVanuatuVenezuela, RBVietnamWest Bank and GazaWorldYemen, Rep.ZambiaZimbabwe Timeline:
This timeline shows a graph from 1962 to 2005 of Papua New Guinea. No data until 1961. Number of actual observations by date: 44.
Source name:
World Development Indicators
Source organization:
World Bank national accounts data, and OECD National Accounts data files.
Categories, topics:
Economy & Growth
Last updated:
apr 23, 2017
Indicators value changes by year
Minimum:
85.68 mln
jan 1, 1962
Maximum:
1.7 bln
jan 1, 1995
At the date of observation
Value
Absolute change
Change from previous value
jan 1, 1962
85.68 mln
+85.68 mln
0.0%
jan 1, 1963
93.408 mln
+7.728 mln
9.02%
jan 1, 1964
104.16 mln
+10.752 mln
11.51%
jan 1, 1965
118.272 mln
+14.112 mln
13.55%
jan 1, 1966
127.898 mln
+9.626 mln
8.14%
jan 1, 1967
134.954 mln
+7.056 mln
5.52%
jan 1, 1968
150.857 mln
+15.903 mln
11.78%
jan 1, 1969
167.208 mln
+16.351 mln
10.84%
jan 1, 1970
194.534 mln
+27.326 mln
16.34%
jan 1, 1971
230.933 mln
+36.399 mln
18.71%
jan 1, 1972
256.796 mln
+25.863 mln
11.2%
jan 1, 1973
295.449 mln
+38.652 mln
15.05%
jan 1, 1974
407.754 mln
+112.306 mln
38.01%
jan 1, 1975
476.102 mln
+68.347 mln
16.76%
jan 1, 1976
492.604 mln
+16.502 mln
3.47%
jan 1, 1977
567.609 mln
+75.005 mln
15.23%
jan 1, 1978
566.464 mln
-1.144 mln
-0.2%
jan 1, 1979
634.081 mln
+67.617 mln
11.94%
jan 1, 1980
716.072 mln
+81.991 mln
12.93%
jan 1, 1981
855.418 mln
+139.346 mln
19.46%
jan 1, 1982
913.076 mln
+57.658 mln
6.74%
jan 1, 1983
868.246 mln
-44.829 mln
-4.91%
jan 1, 1984
828.848 mln
-39.398 mln
-4.54%
jan 1, 1985
797.908 mln
-30.94 mln
-3.73%
jan 1, 1986
779.766 mln
-18.142 mln
-2.27%
jan 1, 1987
808.112 mln
+28.346 mln
3.64%
jan 1, 1988
918.274 mln
+110.162 mln
13.63%
jan 1, 1989
1.015 bln
+96.372 mln
10.49%
jan 1, 1990
1.265 bln
+250.491 mln
24.69%
jan 1, 1991
1.111 bln
-154.11 mln
-12.18%
jan 1, 1992
1.289 bln
+177.508 mln
15.98%
jan 1, 1993
1.363 bln
+74.724 mln
5.8%
jan 1, 1994
1.468 bln
+104.475 mln
7.66%
jan 1, 1995
1.7 bln
+232.023 mln
15.81%
jan 1, 1996
1.363 bln
-336.698 mln
-19.81%
jan 1, 1997
1.472 bln
+108.916 mln
7.99%
jan 1, 1998
1.478 bln
+5.811 mln
0.39%
jan 1, 1999
1.134 bln
-343.718 mln
-23.26%
jan 1, 2000
884.054 mln
-250.016 mln
-22.05%
jan 1, 2001
762.625 mln
-121.43 mln
-13.74%
jan 1, 2002
677.238 mln
-85.387 mln
-11.2%
jan 1, 2003
665.764 mln
-11.474 mln
-1.69%
jan 1, 2004
782.757 mln
+116.993 mln
17.57%
jan 1, 2005
872.022 mln
+89.265 mln
11.4%
Ranking of countries by current statistics by years


Comments: