29
/
en
AIzaSyAYiBZKx7MnpbEhh9jyipgxe19OcubqV5w
April 1, 2024
131175
Ethiopia
ETH
true
2
1
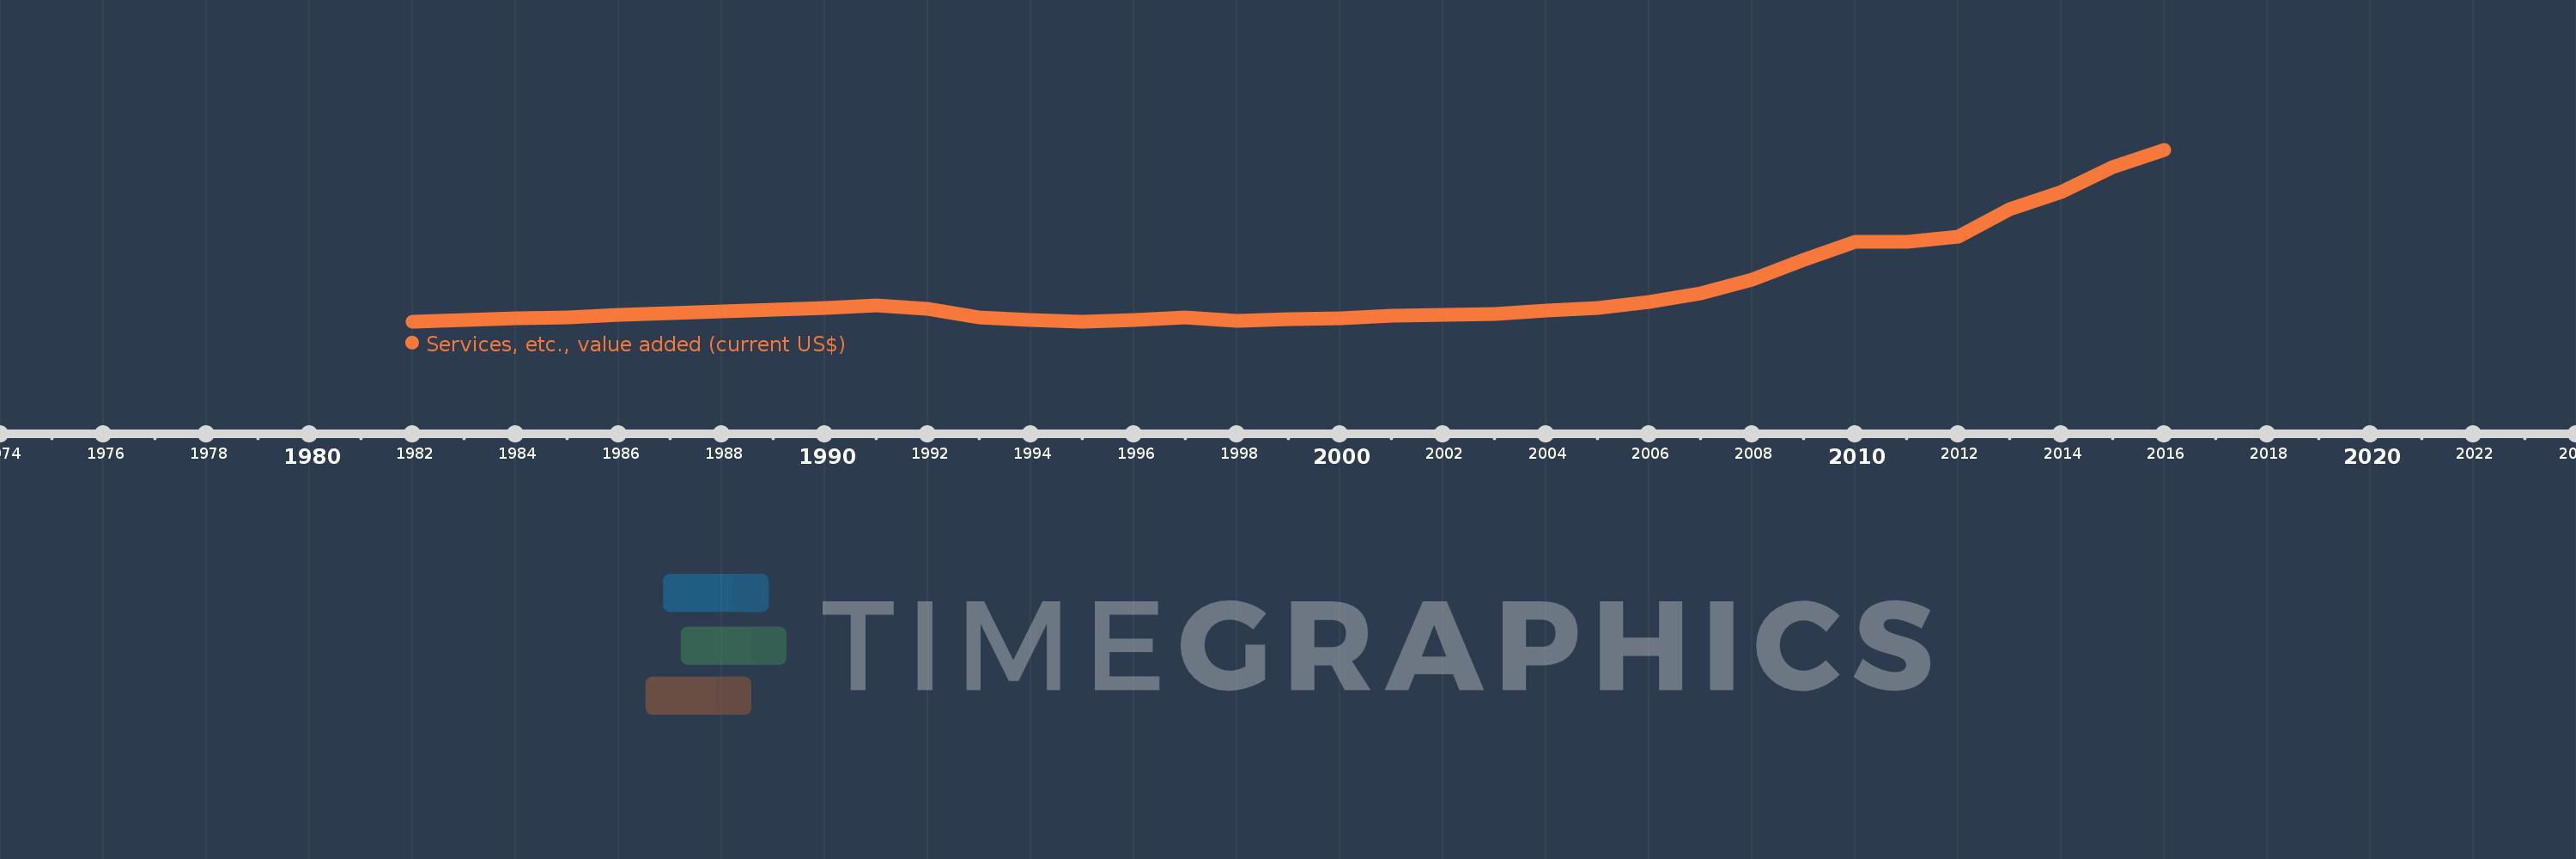
Services, etc., value added (current US$)
2016,2015,2014,2013,2012,2011,2010,2009,2008,2007,2006,2005,2004,2003,2002,2001,2000,1999,1998,1997,1996,1995,1994,1993,1992,1991,1990,1989,1988,1987,1986,1985,1984,1983,1982
This statistics in other country:
AfghanistanAlbaniaAlgeriaAndorraAngolaAntigua and BarbudaArab WorldArgentinaArmeniaArubaAustraliaAustriaAzerbaijanBahamas, TheBahrainBangladeshBarbadosBelarusBelgiumBelizeBeninBermudaBhutanBoliviaBosnia and HerzegovinaBotswanaBrazilBrunei DarussalamBulgariaBurkina FasoBurundiCabo VerdeCambodiaCameroonCanadaCaribbean small statesCentral African RepublicCentral Europe and the BalticsChadChileChinaColombiaComorosCongo, Dem. Rep.Congo, Rep.Costa RicaCote d'IvoireCroatiaCubaCyprusCzech RepublicDenmarkDjiboutiDominicaDominican RepublicEarly-demographic dividendEast Asia & PacificEast Asia & Pacific (excluding high income)East Asia & Pacific (IDA & IBRD countries)EcuadorEgypt, Arab Rep.El SalvadorEquatorial GuineaEritreaEstoniaEthiopiaEuro areaEurope & Central AsiaEurope & Central Asia (excluding high income)Europe & Central Asia (IDA & IBRD countries)European UnionFaroe IslandsFijiFinlandFragile and conflict affected situationsFranceGabonGambia, TheGeorgiaGermanyGhanaGreeceGrenadaGuatemalaGuineaGuinea-BissauGuyanaHeavily indebted poor countries (HIPC)High incomeHondurasHong Kong SAR, ChinaHungaryIBRD onlyIcelandIDA & IBRD totalIDA blendIDA onlyIDA totalIndiaIndonesiaIran, Islamic Rep.IraqIrelandItalyJamaicaJapanJordanKazakhstanKenyaKiribatiKorea, Rep.KosovoKuwaitKyrgyz RepublicLao PDRLate-demographic dividendLatin America & Caribbean Latin America & Caribbean (excluding high income)Latin America & the Caribbean (IDA & IBRD countries)LatviaLeast developed countries: UN classificationLebanonLesothoLiberiaLibyaLithuaniaLow & middle incomeLow incomeLower middle incomeLuxembourgMacao SAR, ChinaMacedonia, FYRMadagascarMalawiMalaysiaMaldivesMaliMaltaMarshall IslandsMauritaniaMauritiusMexicoMicronesia, Fed. Sts.Middle East & North AfricaMiddle East & North Africa (excluding high income)Middle East & North Africa (IDA & IBRD countries)Middle incomeMoldovaMongoliaMontenegroMoroccoMozambiqueMyanmarNamibiaNepalNetherlandsNew CaledoniaNew ZealandNicaraguaNigerNigeriaNorth AmericaNorwayOECD membersOmanOther small statesPacific island small statesPakistanPalauPanamaPapua New GuineaParaguayPeruPhilippinesPolandPortugalPost-demographic dividendPre-demographic dividendPuerto RicoQatarRomaniaRussian FederationRwandaSamoaSao Tome and PrincipeSaudi ArabiaSenegalSerbiaSeychellesSierra LeoneSingaporeSlovak RepublicSloveniaSmall statesSolomon IslandsSouth AfricaSouth AsiaSouth Asia (IDA & IBRD)SpainSri LankaSt. Kitts and NevisSt. LuciaSt. Vincent and the GrenadinesSub-Saharan Africa Sub-Saharan Africa (excluding high income)Sub-Saharan Africa (IDA & IBRD countries)SudanSurinameSwazilandSwedenSwitzerlandSyrian Arab RepublicTajikistanTanzaniaThailandTimor-LesteTogoTongaTrinidad and TobagoTunisiaTurkeyTurkmenistanTuvaluUgandaUkraineUnited Arab EmiratesUnited KingdomUnited StatesUpper middle incomeUruguayUzbekistanVanuatuVenezuela, RBVietnamWest Bank and GazaWorldYemen, Rep.ZambiaZimbabwe Timeline:
This timeline shows a graph from 1982 to 2016 of Ethiopia. No data until 1981. Number of actual observations by date: 35.
Source name:
World Development Indicators
Source organization:
World Bank national accounts data, and OECD National Accounts data files.
Categories, topics:
Economy & Growth
Last updated:
apr 23, 2017
Indicators value changes by year
Minimum:
2.254 bln
jan 1, 1982
Maximum:
24.317 bln
jan 1, 2016
At the date of observation
Value
Absolute change
Change from previous value
jan 1, 1982
2.254 bln
+2.254 bln
0.0%
jan 1, 1983
2.501 bln
+247.425 mln
10.98%
jan 1, 1984
2.721 bln
+220.222 mln
8.81%
jan 1, 1985
2.878 bln
+156.754 mln
5.76%
jan 1, 1986
3.148 bln
+270.111 mln
9.39%
jan 1, 1987
3.335 bln
+186.985 mln
5.94%
jan 1, 1988
3.624 bln
+289.244 mln
8.67%
jan 1, 1989
3.857 bln
+232.129 mln
6.4%
jan 1, 1990
4.106 bln
+249.933 mln
6.48%
jan 1, 1991
4.42 bln
+313.834 mln
7.64%
jan 1, 1992
3.995 bln
-425.261 mln
-9.62%
jan 1, 1993
2.815 bln
-1.18 bln
-29.53%
jan 1, 1994
2.535 bln
-279.969 mln
-9.95%
jan 1, 1995
2.341 bln
-193.651 mln
-7.64%
jan 1, 1996
2.539 bln
+197.704 mln
8.44%
jan 1, 1997
2.844 bln
+305.084 mln
12.02%
jan 1, 1998
2.351 bln
-493.455 mln
-17.35%
jan 1, 1999
2.568 bln
+216.707 mln
9.22%
jan 1, 2000
2.761 bln
+193.88 mln
7.55%
jan 1, 2001
3.087 bln
+325.204 mln
11.78%
jan 1, 2002
3.169 bln
+82.391 mln
2.67%
jan 1, 2003
3.254 bln
+84.621 mln
2.67%
jan 1, 2004
3.687 bln
+433.019 mln
13.31%
jan 1, 2005
4.06 bln
+373.296 mln
10.13%
jan 1, 2006
4.854 bln
+794.483 mln
19.57%
jan 1, 2007
5.894 bln
+1.04 bln
21.42%
jan 1, 2008
7.708 bln
+1.814 bln
30.78%
jan 1, 2009
10.258 bln
+2.55 bln
33.08%
jan 1, 2010
12.576 bln
+2.318 bln
22.59%
jan 1, 2011
12.499 bln
-77.364 mln
-0.62%
jan 1, 2012
13.238 bln
+739.171 mln
5.91%
jan 1, 2013
16.71 bln
+3.472 bln
26.23%
jan 1, 2014
18.902 bln
+2.192 bln
13.12%
jan 1, 2015
22.185 bln
+3.283 bln
17.37%
jan 1, 2016
24.317 bln
+2.132 bln
9.61%
Ranking of countries by current statistics by years


Comments: