29
/
en
AIzaSyAYiBZKx7MnpbEhh9jyipgxe19OcubqV5w
April 1, 2024
156727
Indonesia
IDN
true
2
1
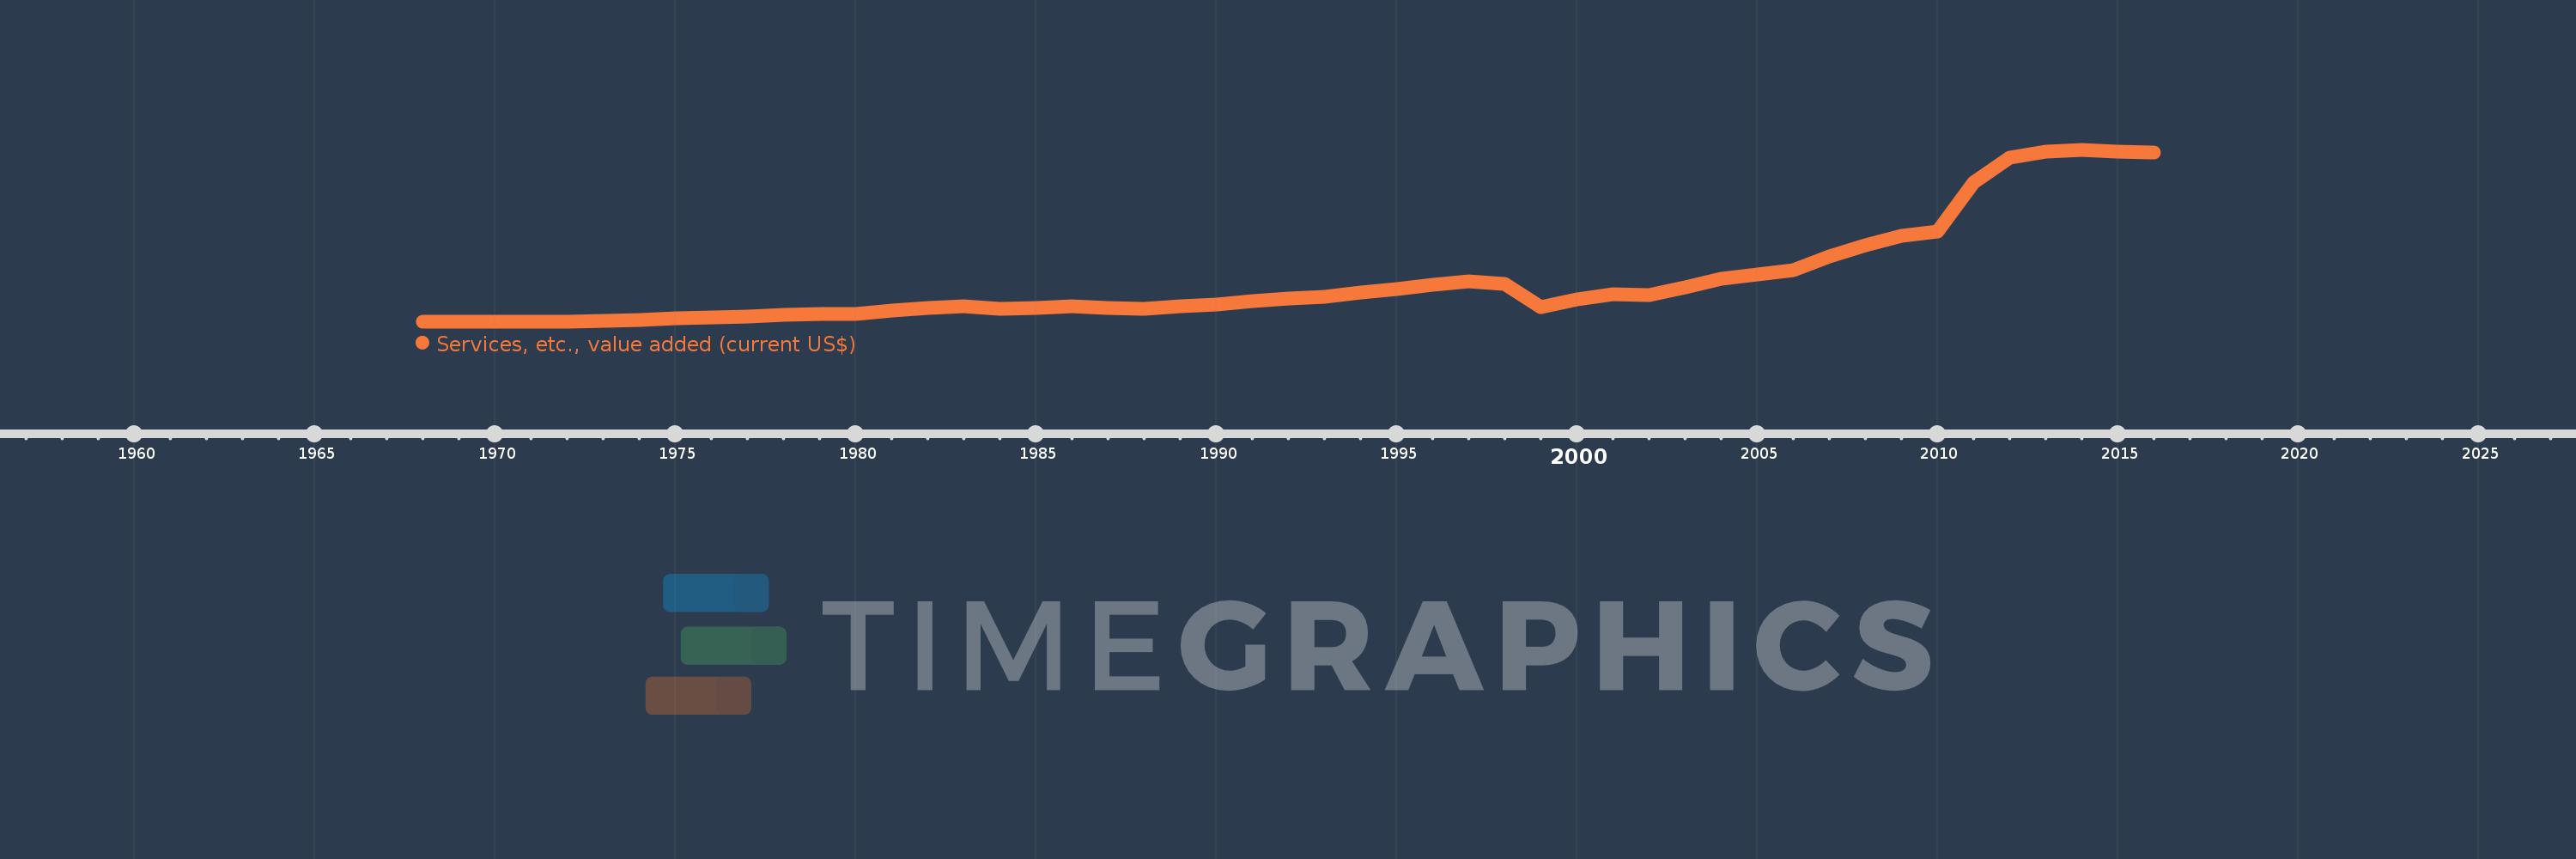
Services, etc., value added (current US$)
2016,2015,2014,2013,2012,2011,2010,2009,2008,2007,2006,2005,2004,2003,2002,2001,2000,1999,1998,1997,1996,1995,1994,1993,1992,1991,1990,1989,1988,1987,1986,1985,1984,1983,1982,1981,1980,1979,1978,1977,1976,1975,1974,1973,1972,1971,1970,1969,1968
This statistics in other country:
AfghanistanAlbaniaAlgeriaAndorraAngolaAntigua and BarbudaArab WorldArgentinaArmeniaArubaAustraliaAustriaAzerbaijanBahamas, TheBahrainBangladeshBarbadosBelarusBelgiumBelizeBeninBermudaBhutanBoliviaBosnia and HerzegovinaBotswanaBrazilBrunei DarussalamBulgariaBurkina FasoBurundiCabo VerdeCambodiaCameroonCanadaCaribbean small statesCentral African RepublicCentral Europe and the BalticsChadChileChinaColombiaComorosCongo, Dem. Rep.Congo, Rep.Costa RicaCote d'IvoireCroatiaCubaCyprusCzech RepublicDenmarkDjiboutiDominicaDominican RepublicEarly-demographic dividendEast Asia & PacificEast Asia & Pacific (excluding high income)East Asia & Pacific (IDA & IBRD countries)EcuadorEgypt, Arab Rep.El SalvadorEquatorial GuineaEritreaEstoniaEthiopiaEuro areaEurope & Central AsiaEurope & Central Asia (excluding high income)Europe & Central Asia (IDA & IBRD countries)European UnionFaroe IslandsFijiFinlandFragile and conflict affected situationsFranceGabonGambia, TheGeorgiaGermanyGhanaGreeceGrenadaGuatemalaGuineaGuinea-BissauGuyanaHeavily indebted poor countries (HIPC)High incomeHondurasHong Kong SAR, ChinaHungaryIBRD onlyIcelandIDA & IBRD totalIDA blendIDA onlyIDA totalIndiaIndonesiaIran, Islamic Rep.IraqIrelandItalyJamaicaJapanJordanKazakhstanKenyaKiribatiKorea, Rep.KosovoKuwaitKyrgyz RepublicLao PDRLate-demographic dividendLatin America & Caribbean Latin America & Caribbean (excluding high income)Latin America & the Caribbean (IDA & IBRD countries)LatviaLeast developed countries: UN classificationLebanonLesothoLiberiaLibyaLithuaniaLow & middle incomeLow incomeLower middle incomeLuxembourgMacao SAR, ChinaMacedonia, FYRMadagascarMalawiMalaysiaMaldivesMaliMaltaMarshall IslandsMauritaniaMauritiusMexicoMicronesia, Fed. Sts.Middle East & North AfricaMiddle East & North Africa (excluding high income)Middle East & North Africa (IDA & IBRD countries)Middle incomeMoldovaMongoliaMontenegroMoroccoMozambiqueMyanmarNamibiaNepalNetherlandsNew CaledoniaNew ZealandNicaraguaNigerNigeriaNorth AmericaNorwayOECD membersOmanOther small statesPacific island small statesPakistanPalauPanamaPapua New GuineaParaguayPeruPhilippinesPolandPortugalPost-demographic dividendPre-demographic dividendPuerto RicoQatarRomaniaRussian FederationRwandaSamoaSao Tome and PrincipeSaudi ArabiaSenegalSerbiaSeychellesSierra LeoneSingaporeSlovak RepublicSloveniaSmall statesSolomon IslandsSouth AfricaSouth AsiaSouth Asia (IDA & IBRD)SpainSri LankaSt. Kitts and NevisSt. LuciaSt. Vincent and the GrenadinesSub-Saharan Africa Sub-Saharan Africa (excluding high income)Sub-Saharan Africa (IDA & IBRD countries)SudanSurinameSwazilandSwedenSwitzerlandSyrian Arab RepublicTajikistanTanzaniaThailandTimor-LesteTogoTongaTrinidad and TobagoTunisiaTurkeyTurkmenistanTuvaluUgandaUkraineUnited Arab EmiratesUnited KingdomUnited StatesUpper middle incomeUruguayUzbekistanVanuatuVenezuela, RBVietnamWest Bank and GazaWorldYemen, Rep.ZambiaZimbabwe Timeline:
This timeline shows a graph from 1968 to 2016 of Indonesia. No data until 1967. Number of actual observations by date: 49.
Source name:
World Development Indicators
Source organization:
World Bank national accounts data, and OECD National Accounts data files.
Categories, topics:
Economy & Growth
Last updated:
apr 23, 2017
Indicators value changes by year
Minimum:
2.145 bln
jan 1, 1968
Maximum:
378.848 bln
jan 1, 2014
At the date of observation
Value
Absolute change
Change from previous value
jan 1, 1968
2.145 bln
+2.145 bln
0.0%
jan 1, 1969
2.649 bln
+504.972 mln
23.55%
jan 1, 1970
3.089 bln
+439.718 mln
16.6%
jan 1, 1971
3.512 bln
+423.041 mln
13.69%
jan 1, 1972
3.593 bln
+81.13 mln
2.31%
jan 1, 1973
4.224 bln
+631.106 mln
17.56%
jan 1, 1974
6.047 bln
+1.822 bln
43.14%
jan 1, 1975
9.446 bln
+3.399 bln
56.21%
jan 1, 1976
11.686 bln
+2.24 bln
23.71%
jan 1, 1977
14.268 bln
+2.582 bln
22.1%
jan 1, 1978
17.505 bln
+3.237 bln
22.69%
jan 1, 1979
19.636 bln
+2.131 bln
12.17%
jan 1, 1980
19.303 bln
-332.898 mln
-1.7%
jan 1, 1981
26.768 bln
+7.465 bln
38.67%
jan 1, 1982
32.759 bln
+5.991 bln
22.38%
jan 1, 1983
36.136 bln
+3.377 bln
10.31%
jan 1, 1984
31.832 bln
-4.304 bln
-11.91%
jan 1, 1985
33.437 bln
+1.605 bln
5.04%
jan 1, 1986
35.76 bln
+2.324 bln
6.95%
jan 1, 1987
33.655 bln
-2.105 bln
-5.89%
jan 1, 1988
30.688 bln
-2.968 bln
-8.82%
jan 1, 1989
35.738 bln
+5.05 bln
16.46%
jan 1, 1990
40.579 bln
+4.841 bln
13.55%
jan 1, 1991
47.454 bln
+6.876 bln
16.94%
jan 1, 1992
52.986 bln
+5.532 bln
11.66%
jan 1, 1993
57.981 bln
+4.994 bln
9.43%
jan 1, 1994
67.058 bln
+9.077 bln
15.66%
jan 1, 1995
74.422 bln
+7.364 bln
10.98%
jan 1, 1996
82.997 bln
+8.576 bln
11.52%
jan 1, 1997
90.657 bln
+7.66 bln
9.23%
jan 1, 1998
85.391 bln
-5.266 bln
-5.81%
jan 1, 1999
35.018 bln
-50.373 bln
-58.99%
jan 1, 2000
51.839 bln
+16.821 bln
48.03%
jan 1, 2001
63.488 bln
+11.649 bln
22.47%
jan 1, 2002
61.379 bln
-2.109 bln
-3.32%
jan 1, 2003
78.422 bln
+17.043 bln
27.77%
jan 1, 2004
96.41 bln
+17.988 bln
22.94%
jan 1, 2005
105.397 bln
+8.988 bln
9.32%
jan 1, 2006
115.297 bln
+9.9 bln
9.39%
jan 1, 2007
146.129 bln
+30.832 bln
26.74%
jan 1, 2008
170.657 bln
+24.528 bln
16.78%
jan 1, 2009
191.119 bln
+20.462 bln
11.99%
jan 1, 2010
199.956 bln
+8.837 bln
4.62%
jan 1, 2011
307.067 bln
+107.11 bln
53.57%
jan 1, 2012
362.408 bln
+55.341 bln
18.02%
jan 1, 2013
375.164 bln
+12.756 bln
3.52%
jan 1, 2014
378.848 bln
+3.684 bln
0.98%
jan 1, 2015
376.385 bln
-2.463 bln
-0.65%
jan 1, 2016
373.423 bln
-2.962 bln
-0.79%
Ranking of countries by current statistics by years


Comments: