29
/
en
AIzaSyAYiBZKx7MnpbEhh9jyipgxe19OcubqV5w
April 1, 2024
78957
Bangladesh
BGD
true
2
1
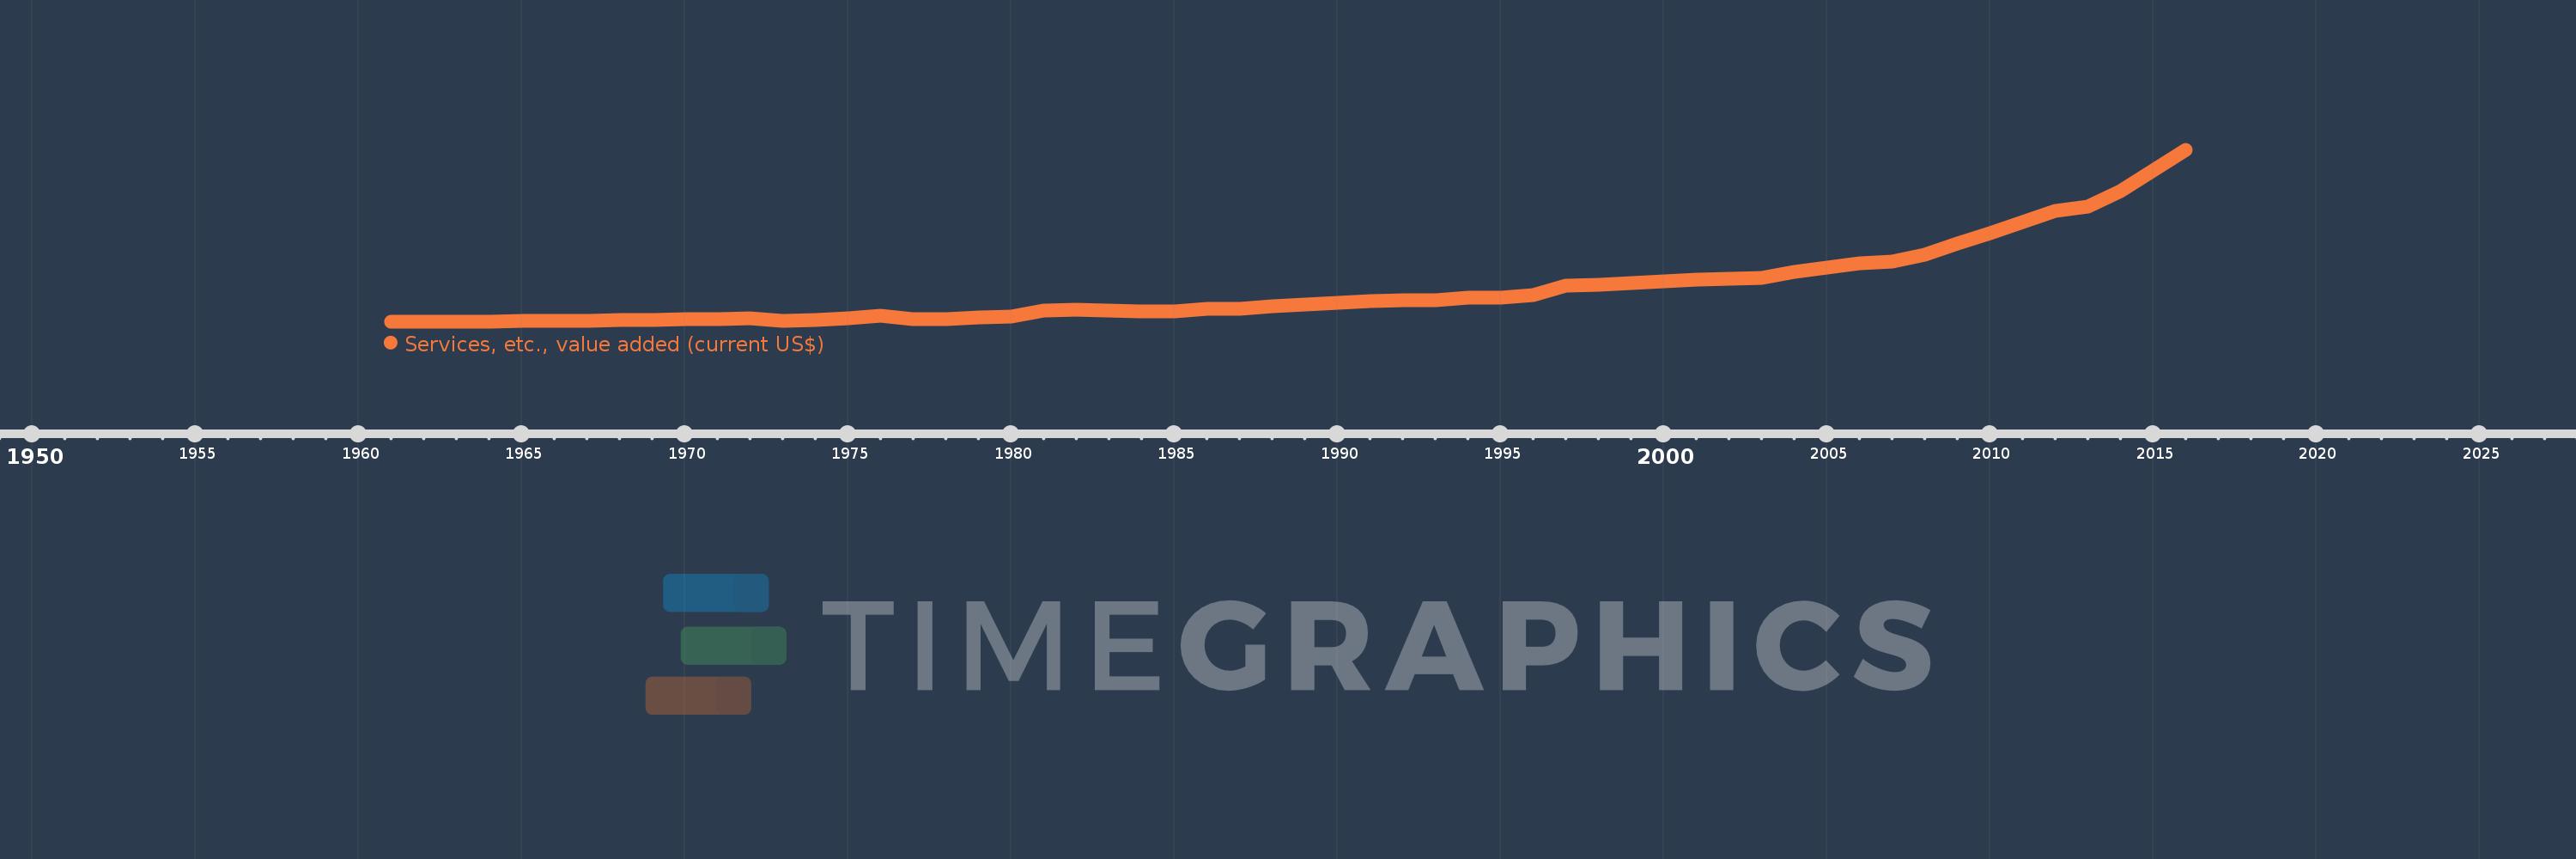
Services, etc., value added (current US$)
2016,2015,2014,2013,2012,2011,2010,2009,2008,2007,2006,2005,2004,2003,2002,2001,2000,1999,1998,1997,1996,1995,1994,1993,1992,1991,1990,1989,1988,1987,1986,1985,1984,1983,1982,1981,1980,1979,1978,1977,1976,1975,1974,1973,1972,1971,1970,1969,1968,1967,1966,1965,1964,1963,1962,1961
This statistics in other country:
AfghanistanAlbaniaAlgeriaAndorraAngolaAntigua and BarbudaArab WorldArgentinaArmeniaArubaAustraliaAustriaAzerbaijanBahamas, TheBahrainBangladeshBarbadosBelarusBelgiumBelizeBeninBermudaBhutanBoliviaBosnia and HerzegovinaBotswanaBrazilBrunei DarussalamBulgariaBurkina FasoBurundiCabo VerdeCambodiaCameroonCanadaCaribbean small statesCentral African RepublicCentral Europe and the BalticsChadChileChinaColombiaComorosCongo, Dem. Rep.Congo, Rep.Costa RicaCote d'IvoireCroatiaCubaCyprusCzech RepublicDenmarkDjiboutiDominicaDominican RepublicEarly-demographic dividendEast Asia & PacificEast Asia & Pacific (excluding high income)East Asia & Pacific (IDA & IBRD countries)EcuadorEgypt, Arab Rep.El SalvadorEquatorial GuineaEritreaEstoniaEthiopiaEuro areaEurope & Central AsiaEurope & Central Asia (excluding high income)Europe & Central Asia (IDA & IBRD countries)European UnionFaroe IslandsFijiFinlandFragile and conflict affected situationsFranceGabonGambia, TheGeorgiaGermanyGhanaGreeceGrenadaGuatemalaGuineaGuinea-BissauGuyanaHeavily indebted poor countries (HIPC)High incomeHondurasHong Kong SAR, ChinaHungaryIBRD onlyIcelandIDA & IBRD totalIDA blendIDA onlyIDA totalIndiaIndonesiaIran, Islamic Rep.IraqIrelandItalyJamaicaJapanJordanKazakhstanKenyaKiribatiKorea, Rep.KosovoKuwaitKyrgyz RepublicLao PDRLate-demographic dividendLatin America & Caribbean Latin America & Caribbean (excluding high income)Latin America & the Caribbean (IDA & IBRD countries)LatviaLeast developed countries: UN classificationLebanonLesothoLiberiaLibyaLithuaniaLow & middle incomeLow incomeLower middle incomeLuxembourgMacao SAR, ChinaMacedonia, FYRMadagascarMalawiMalaysiaMaldivesMaliMaltaMarshall IslandsMauritaniaMauritiusMexicoMicronesia, Fed. Sts.Middle East & North AfricaMiddle East & North Africa (excluding high income)Middle East & North Africa (IDA & IBRD countries)Middle incomeMoldovaMongoliaMontenegroMoroccoMozambiqueMyanmarNamibiaNepalNetherlandsNew CaledoniaNew ZealandNicaraguaNigerNigeriaNorth AmericaNorwayOECD membersOmanOther small statesPacific island small statesPakistanPalauPanamaPapua New GuineaParaguayPeruPhilippinesPolandPortugalPost-demographic dividendPre-demographic dividendPuerto RicoQatarRomaniaRussian FederationRwandaSamoaSao Tome and PrincipeSaudi ArabiaSenegalSerbiaSeychellesSierra LeoneSingaporeSlovak RepublicSloveniaSmall statesSolomon IslandsSouth AfricaSouth AsiaSouth Asia (IDA & IBRD)SpainSri LankaSt. Kitts and NevisSt. LuciaSt. Vincent and the GrenadinesSub-Saharan Africa Sub-Saharan Africa (excluding high income)Sub-Saharan Africa (IDA & IBRD countries)SudanSurinameSwazilandSwedenSwitzerlandSyrian Arab RepublicTajikistanTanzaniaThailandTimor-LesteTogoTongaTrinidad and TobagoTunisiaTurkeyTurkmenistanTuvaluUgandaUkraineUnited Arab EmiratesUnited KingdomUnited StatesUpper middle incomeUruguayUzbekistanVanuatuVenezuela, RBVietnamWest Bank and GazaWorldYemen, Rep.ZambiaZimbabwe Timeline:
This timeline shows a graph from 1961 to 2016 of Bangladesh. No data until 1960. Number of actual observations by date: 56.
Source name:
World Development Indicators
Source organization:
World Bank national accounts data, and OECD National Accounts data files.
Categories, topics:
Economy & Growth
Last updated:
apr 23, 2017
Indicators value changes by year
Minimum:
1.52 bln
jan 1, 1961
Maximum:
104.784 bln
jan 1, 2016
At the date of observation
Value
Absolute change
Change from previous value
jan 1, 1961
1.52 bln
+1.52 bln
0.0%
jan 1, 1962
1.697 bln
+176.834 mln
11.64%
jan 1, 1963
1.779 bln
+82.749 mln
4.88%
jan 1, 1964
1.864 bln
+85.016 mln
4.78%
jan 1, 1965
1.951 bln
+86.433 mln
4.64%
jan 1, 1966
2.153 bln
+202.622 mln
10.39%
jan 1, 1967
2.301 bln
+147.928 mln
6.87%
jan 1, 1968
2.615 bln
+313.143 mln
13.61%
jan 1, 1969
2.783 bln
+168.049 mln
6.43%
jan 1, 1970
2.999 bln
+216.224 mln
7.77%
jan 1, 1971
3.301 bln
+302.374 mln
10.08%
jan 1, 1972
3.613 bln
+312.009 mln
9.45%
jan 1, 1973
2.159 bln
-1.455 bln
-40.26%
jan 1, 1974
2.527 bln
+368.664 mln
17.08%
jan 1, 1975
3.753 bln
+1.225 bln
48.49%
jan 1, 1976
5.141 bln
+1.389 bln
37.0%
jan 1, 1977
3.403 bln
-1.738 bln
-33.81%
jan 1, 1978
3.317 bln
-85.65 mln
-2.52%
jan 1, 1979
4.176 bln
+858.408 mln
25.88%
jan 1, 1980
4.959 bln
+783.616 mln
18.77%
jan 1, 1981
8.455 bln
+3.496 bln
70.49%
jan 1, 1982
9.101 bln
+646.243 mln
7.64%
jan 1, 1983
8.408 bln
-692.913 mln
-7.61%
jan 1, 1984
7.955 bln
-453.088 mln
-5.39%
jan 1, 1985
7.725 bln
-230.265 mln
-2.89%
jan 1, 1986
9.666 bln
+1.941 bln
25.12%
jan 1, 1987
9.595 bln
-70.595 mln
-0.73%
jan 1, 1988
10.732 bln
+1.136 bln
11.84%
jan 1, 1989
11.947 bln
+1.215 bln
11.32%
jan 1, 1990
13.132 bln
+1.185 bln
9.92%
jan 1, 1991
14.317 bln
+1.185 bln
9.02%
jan 1, 1992
14.406 bln
+88.331 mln
0.62%
jan 1, 1993
14.748 bln
+342.214 mln
2.38%
jan 1, 1994
15.948 bln
+1.2 bln
8.14%
jan 1, 1995
16.305 bln
+356.28 mln
2.23%
jan 1, 1996
17.87 bln
+1.565 bln
9.6%
jan 1, 1997
23.277 bln
+5.407 bln
30.26%
jan 1, 1998
24.09 bln
+813.479 mln
3.49%
jan 1, 1999
24.909 bln
+818.721 mln
3.4%
jan 1, 2000
25.738 bln
+829.088 mln
3.33%
jan 1, 2001
26.987 bln
+1.249 bln
4.85%
jan 1, 2002
27.309 bln
+321.719 mln
1.19%
jan 1, 2003
28.223 bln
+913.673 mln
3.35%
jan 1, 2004
31.524 bln
+3.301 bln
11.7%
jan 1, 2005
34.381 bln
+2.858 bln
9.06%
jan 1, 2006
36.721 bln
+2.34 bln
6.81%
jan 1, 2007
37.881 bln
+1.159 bln
3.16%
jan 1, 2008
42.102 bln
+4.221 bln
11.14%
jan 1, 2009
48.502 bln
+6.4 bln
15.2%
jan 1, 2010
54.645 bln
+6.142 bln
12.66%
jan 1, 2011
61.672 bln
+7.028 bln
12.86%
jan 1, 2012
68.237 bln
+6.565 bln
10.64%
jan 1, 2013
70.881 bln
+2.644 bln
3.87%
jan 1, 2014
80.08 bln
+9.199 bln
12.98%
jan 1, 2015
92.728 bln
+12.648 bln
15.79%
jan 1, 2016
104.784 bln
+12.056 bln
13.0%
Ranking of countries by current statistics by years


Comments: