29
/
en
AIzaSyAYiBZKx7MnpbEhh9jyipgxe19OcubqV5w
April 1, 2024
114302
Cote d'Ivoire
CIV
true
2
1
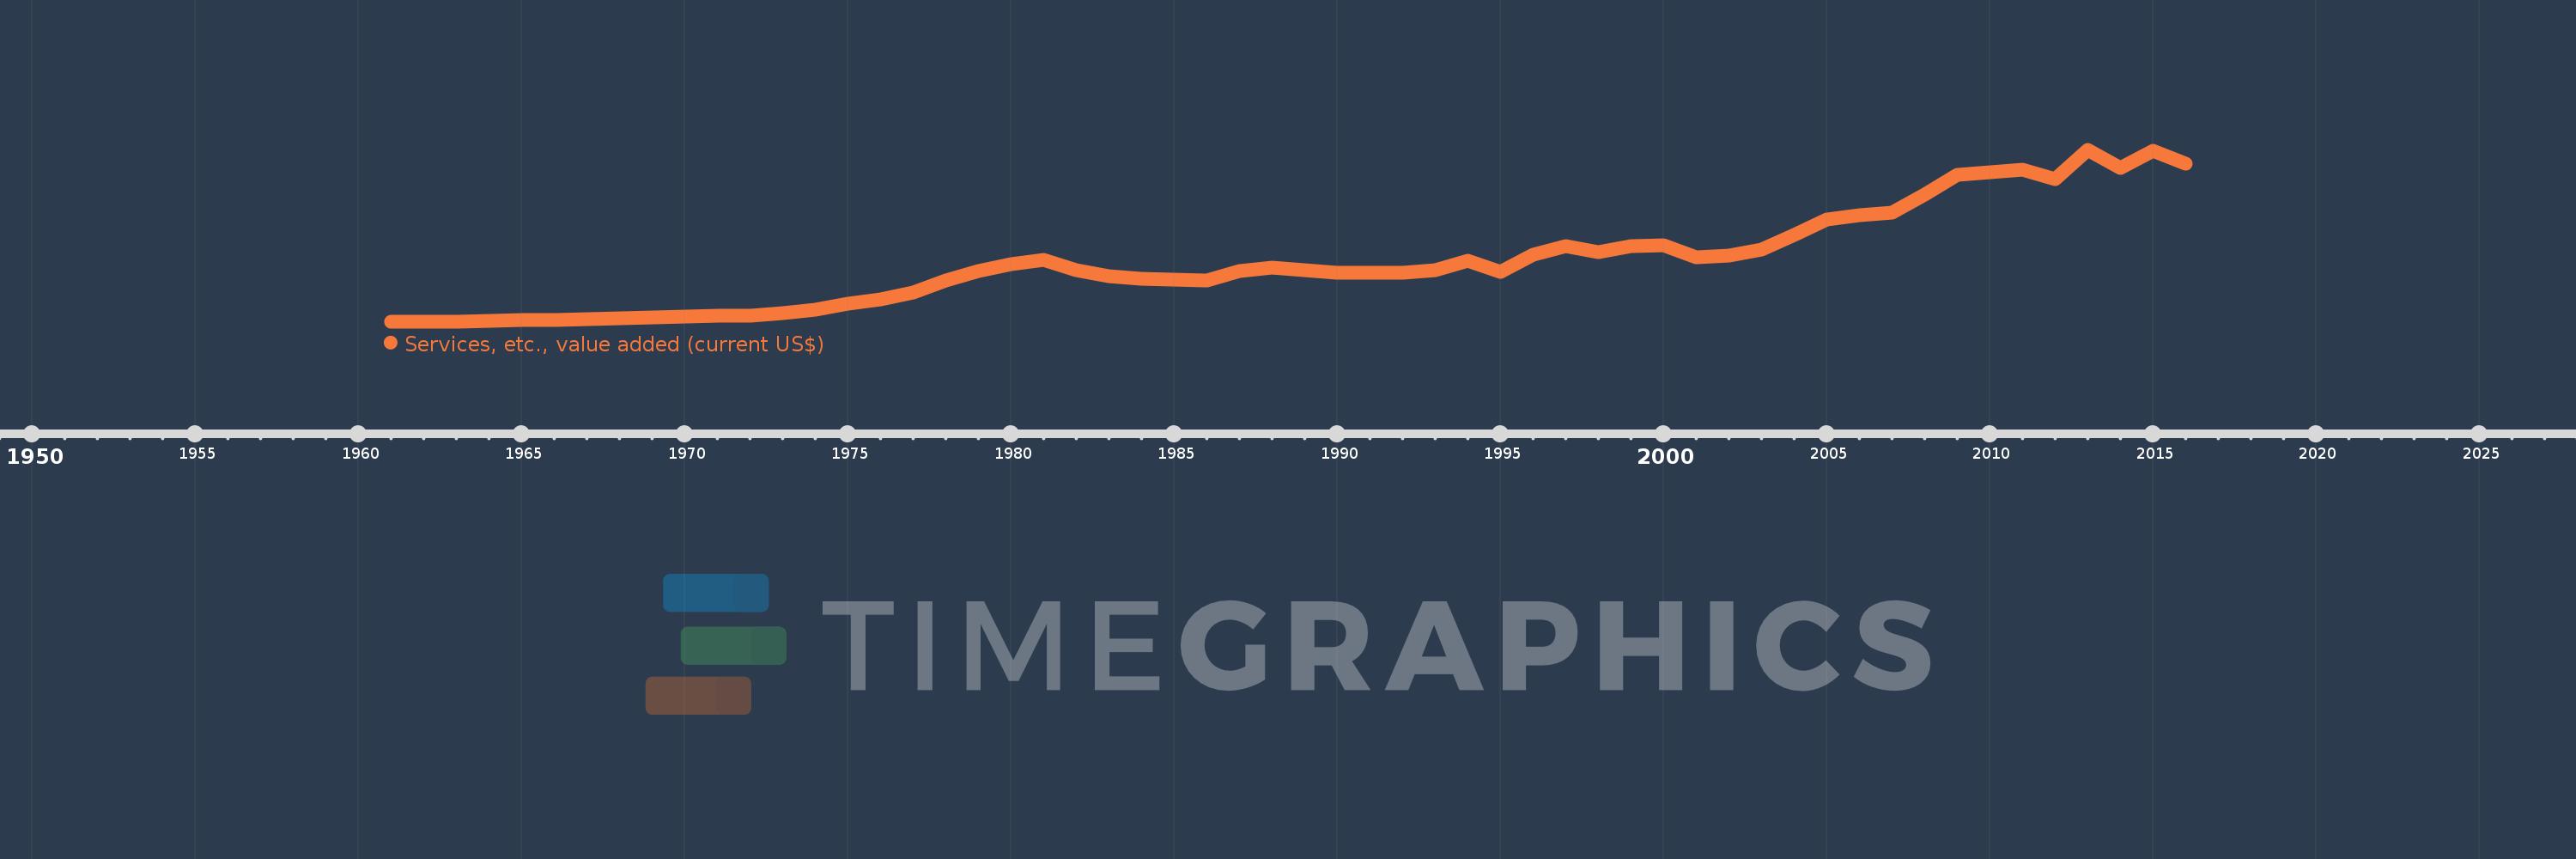
Services, etc., value added (current US$)
2016,2015,2014,2013,2012,2011,2010,2009,2008,2007,2006,2005,2004,2003,2002,2001,2000,1999,1998,1997,1996,1995,1994,1993,1992,1991,1990,1989,1988,1987,1986,1985,1984,1983,1982,1981,1980,1979,1978,1977,1976,1975,1974,1973,1972,1971,1970,1969,1968,1967,1966,1965,1964,1963,1962,1961
This statistics in other country:
AfghanistanAlbaniaAlgeriaAndorraAngolaAntigua and BarbudaArab WorldArgentinaArmeniaArubaAustraliaAustriaAzerbaijanBahamas, TheBahrainBangladeshBarbadosBelarusBelgiumBelizeBeninBermudaBhutanBoliviaBosnia and HerzegovinaBotswanaBrazilBrunei DarussalamBulgariaBurkina FasoBurundiCabo VerdeCambodiaCameroonCanadaCaribbean small statesCentral African RepublicCentral Europe and the BalticsChadChileChinaColombiaComorosCongo, Dem. Rep.Congo, Rep.Costa RicaCote d'IvoireCroatiaCubaCyprusCzech RepublicDenmarkDjiboutiDominicaDominican RepublicEarly-demographic dividendEast Asia & PacificEast Asia & Pacific (excluding high income)East Asia & Pacific (IDA & IBRD countries)EcuadorEgypt, Arab Rep.El SalvadorEquatorial GuineaEritreaEstoniaEthiopiaEuro areaEurope & Central AsiaEurope & Central Asia (excluding high income)Europe & Central Asia (IDA & IBRD countries)European UnionFaroe IslandsFijiFinlandFragile and conflict affected situationsFranceGabonGambia, TheGeorgiaGermanyGhanaGreeceGrenadaGuatemalaGuineaGuinea-BissauGuyanaHeavily indebted poor countries (HIPC)High incomeHondurasHong Kong SAR, ChinaHungaryIBRD onlyIcelandIDA & IBRD totalIDA blendIDA onlyIDA totalIndiaIndonesiaIran, Islamic Rep.IraqIrelandItalyJamaicaJapanJordanKazakhstanKenyaKiribatiKorea, Rep.KosovoKuwaitKyrgyz RepublicLao PDRLate-demographic dividendLatin America & Caribbean Latin America & Caribbean (excluding high income)Latin America & the Caribbean (IDA & IBRD countries)LatviaLeast developed countries: UN classificationLebanonLesothoLiberiaLibyaLithuaniaLow & middle incomeLow incomeLower middle incomeLuxembourgMacao SAR, ChinaMacedonia, FYRMadagascarMalawiMalaysiaMaldivesMaliMaltaMarshall IslandsMauritaniaMauritiusMexicoMicronesia, Fed. Sts.Middle East & North AfricaMiddle East & North Africa (excluding high income)Middle East & North Africa (IDA & IBRD countries)Middle incomeMoldovaMongoliaMontenegroMoroccoMozambiqueMyanmarNamibiaNepalNetherlandsNew CaledoniaNew ZealandNicaraguaNigerNigeriaNorth AmericaNorwayOECD membersOmanOther small statesPacific island small statesPakistanPalauPanamaPapua New GuineaParaguayPeruPhilippinesPolandPortugalPost-demographic dividendPre-demographic dividendPuerto RicoQatarRomaniaRussian FederationRwandaSamoaSao Tome and PrincipeSaudi ArabiaSenegalSerbiaSeychellesSierra LeoneSingaporeSlovak RepublicSloveniaSmall statesSolomon IslandsSouth AfricaSouth AsiaSouth Asia (IDA & IBRD)SpainSri LankaSt. Kitts and NevisSt. LuciaSt. Vincent and the GrenadinesSub-Saharan Africa Sub-Saharan Africa (excluding high income)Sub-Saharan Africa (IDA & IBRD countries)SudanSurinameSwazilandSwedenSwitzerlandSyrian Arab RepublicTajikistanTanzaniaThailandTimor-LesteTogoTongaTrinidad and TobagoTunisiaTurkeyTurkmenistanTuvaluUgandaUkraineUnited Arab EmiratesUnited KingdomUnited StatesUpper middle incomeUruguayUzbekistanVanuatuVenezuela, RBVietnamWest Bank and GazaWorldYemen, Rep.ZambiaZimbabwe Timeline:
This timeline shows a graph from 1961 to 2016 of Cote d'Ivoire. No data until 1960. Number of actual observations by date: 56.
Source name:
World Development Indicators
Source organization:
World Bank national accounts data, and OECD National Accounts data files.
Categories, topics:
Economy & Growth
Last updated:
apr 23, 2017
Indicators value changes by year
Minimum:
212.764 mln
jan 1, 1961
Maximum:
14.906 bln
jan 1, 2013
At the date of observation
Value
Absolute change
Change from previous value
jan 1, 1961
212.764 mln
+212.764 mln
0.0%
jan 1, 1962
245.531 mln
+32.767 mln
15.4%
jan 1, 1963
258.85 mln
+13.318 mln
5.42%
jan 1, 1964
313.039 mln
+54.19 mln
20.93%
jan 1, 1965
406.51 mln
+93.471 mln
29.86%
jan 1, 1966
408.878 mln
+2.368 mln
0.58%
jan 1, 1967
457.509 mln
+48.631 mln
11.89%
jan 1, 1968
502.031 mln
+44.522 mln
9.73%
jan 1, 1969
616.808 mln
+114.778 mln
22.86%
jan 1, 1970
694.336 mln
+77.528 mln
12.57%
jan 1, 1971
722.496 mln
+28.16 mln
4.06%
jan 1, 1972
782.985 mln
+60.489 mln
8.37%
jan 1, 1973
933.231 mln
+150.246 mln
19.19%
jan 1, 1974
1.284 bln
+351.263 mln
37.64%
jan 1, 1975
1.794 bln
+509.82 mln
39.69%
jan 1, 1976
2.131 bln
+336.215 mln
18.74%
jan 1, 1977
2.758 bln
+627.364 mln
29.45%
jan 1, 1978
3.795 bln
+1.037 bln
37.61%
jan 1, 1979
4.554 bln
+758.651 mln
19.99%
jan 1, 1980
5.169 bln
+615.361 mln
13.51%
jan 1, 1981
5.533 bln
+364.228 mln
7.05%
jan 1, 1982
4.628 bln
-905.795 mln
-16.37%
jan 1, 1983
4.131 bln
-497.004 mln
-10.74%
jan 1, 1984
3.873 bln
-257.65 mln
-6.24%
jan 1, 1985
3.853 bln
-19.955 mln
-0.52%
jan 1, 1986
3.748 bln
-104.884 mln
-2.72%
jan 1, 1987
4.603 bln
+854.46 mln
22.8%
jan 1, 1988
4.888 bln
+285.153 mln
6.2%
jan 1, 1989
4.647 bln
-241.149 mln
-4.93%
jan 1, 1990
4.44 bln
-206.993 mln
-4.45%
jan 1, 1991
4.452 bln
+11.991 mln
0.27%
jan 1, 1992
4.418 bln
-33.406 mln
-0.75%
jan 1, 1993
4.634 bln
+215.678 mln
4.88%
jan 1, 1994
5.416 bln
+781.964 mln
16.87%
jan 1, 1995
4.464 bln
-951.742 mln
-17.57%
jan 1, 1996
5.996 bln
+1.531 bln
34.31%
jan 1, 1997
6.674 bln
+678.47 mln
11.32%
jan 1, 1998
6.216 bln
-457.718 mln
-6.86%
jan 1, 1999
6.69 bln
+473.767 mln
7.62%
jan 1, 2000
6.794 bln
+103.53 mln
1.55%
jan 1, 2001
5.734 bln
-1.059 bln
-15.59%
jan 1, 2002
5.909 bln
+175.016 mln
3.05%
jan 1, 2003
6.374 bln
+464.919 mln
7.87%
jan 1, 2004
7.676 bln
+1.301 bln
20.42%
jan 1, 2005
9.006 bln
+1.33 bln
17.33%
jan 1, 2006
9.327 bln
+321.086 mln
3.57%
jan 1, 2007
9.584 bln
+257.818 mln
2.76%
jan 1, 2008
11.135 bln
+1.55 bln
16.18%
jan 1, 2009
12.823 bln
+1.688 bln
15.16%
jan 1, 2010
13.05 bln
+227.232 mln
1.77%
jan 1, 2011
13.204 bln
+154.358 mln
1.18%
jan 1, 2012
12.461 bln
-743.187 mln
-5.63%
jan 1, 2013
14.906 bln
+2.445 bln
19.62%
jan 1, 2014
13.402 bln
-1.504 bln
-10.09%
jan 1, 2015
14.853 bln
+1.451 bln
10.83%
jan 1, 2016
13.785 bln
-1.068 bln
-7.19%
Ranking of countries by current statistics by years


Comments: