29
/
en
AIzaSyAYiBZKx7MnpbEhh9jyipgxe19OcubqV5w
April 1, 2024
117417
Cyprus
CYP
true
2
1
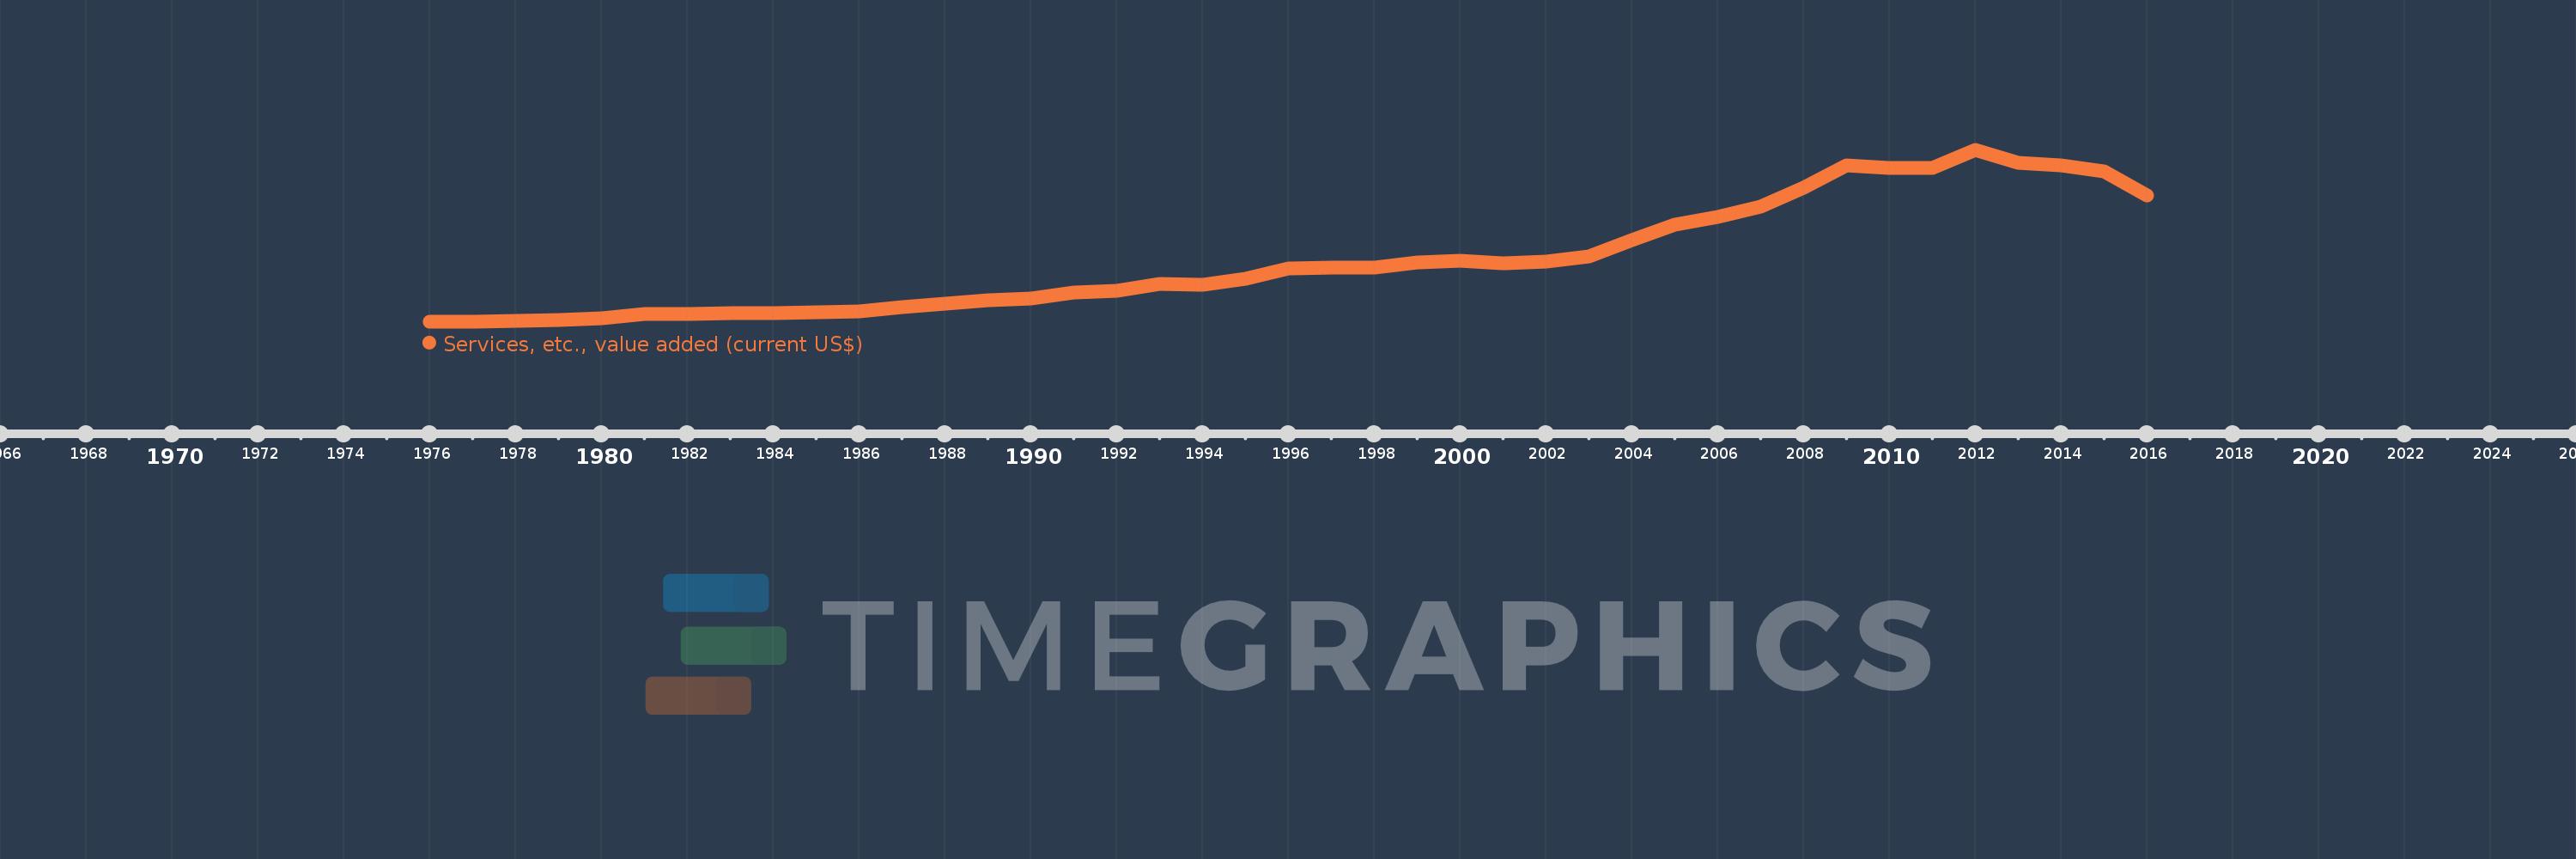
Services, etc., value added (current US$)
2016,2015,2014,2013,2012,2011,2010,2009,2008,2007,2006,2005,2004,2003,2002,2001,2000,1999,1998,1997,1996,1995,1994,1993,1992,1991,1990,1989,1988,1987,1986,1985,1984,1983,1982,1981,1980,1979,1978,1977,1976
This statistics in other country:
AfghanistanAlbaniaAlgeriaAndorraAngolaAntigua and BarbudaArab WorldArgentinaArmeniaArubaAustraliaAustriaAzerbaijanBahamas, TheBahrainBangladeshBarbadosBelarusBelgiumBelizeBeninBermudaBhutanBoliviaBosnia and HerzegovinaBotswanaBrazilBrunei DarussalamBulgariaBurkina FasoBurundiCabo VerdeCambodiaCameroonCanadaCaribbean small statesCentral African RepublicCentral Europe and the BalticsChadChileChinaColombiaComorosCongo, Dem. Rep.Congo, Rep.Costa RicaCote d'IvoireCroatiaCubaCyprusCzech RepublicDenmarkDjiboutiDominicaDominican RepublicEarly-demographic dividendEast Asia & PacificEast Asia & Pacific (excluding high income)East Asia & Pacific (IDA & IBRD countries)EcuadorEgypt, Arab Rep.El SalvadorEquatorial GuineaEritreaEstoniaEthiopiaEuro areaEurope & Central AsiaEurope & Central Asia (excluding high income)Europe & Central Asia (IDA & IBRD countries)European UnionFaroe IslandsFijiFinlandFragile and conflict affected situationsFranceGabonGambia, TheGeorgiaGermanyGhanaGreeceGrenadaGuatemalaGuineaGuinea-BissauGuyanaHeavily indebted poor countries (HIPC)High incomeHondurasHong Kong SAR, ChinaHungaryIBRD onlyIcelandIDA & IBRD totalIDA blendIDA onlyIDA totalIndiaIndonesiaIran, Islamic Rep.IraqIrelandItalyJamaicaJapanJordanKazakhstanKenyaKiribatiKorea, Rep.KosovoKuwaitKyrgyz RepublicLao PDRLate-demographic dividendLatin America & Caribbean Latin America & Caribbean (excluding high income)Latin America & the Caribbean (IDA & IBRD countries)LatviaLeast developed countries: UN classificationLebanonLesothoLiberiaLibyaLithuaniaLow & middle incomeLow incomeLower middle incomeLuxembourgMacao SAR, ChinaMacedonia, FYRMadagascarMalawiMalaysiaMaldivesMaliMaltaMarshall IslandsMauritaniaMauritiusMexicoMicronesia, Fed. Sts.Middle East & North AfricaMiddle East & North Africa (excluding high income)Middle East & North Africa (IDA & IBRD countries)Middle incomeMoldovaMongoliaMontenegroMoroccoMozambiqueMyanmarNamibiaNepalNetherlandsNew CaledoniaNew ZealandNicaraguaNigerNigeriaNorth AmericaNorwayOECD membersOmanOther small statesPacific island small statesPakistanPalauPanamaPapua New GuineaParaguayPeruPhilippinesPolandPortugalPost-demographic dividendPre-demographic dividendPuerto RicoQatarRomaniaRussian FederationRwandaSamoaSao Tome and PrincipeSaudi ArabiaSenegalSerbiaSeychellesSierra LeoneSingaporeSlovak RepublicSloveniaSmall statesSolomon IslandsSouth AfricaSouth AsiaSouth Asia (IDA & IBRD)SpainSri LankaSt. Kitts and NevisSt. LuciaSt. Vincent and the GrenadinesSub-Saharan Africa Sub-Saharan Africa (excluding high income)Sub-Saharan Africa (IDA & IBRD countries)SudanSurinameSwazilandSwedenSwitzerlandSyrian Arab RepublicTajikistanTanzaniaThailandTimor-LesteTogoTongaTrinidad and TobagoTunisiaTurkeyTurkmenistanTuvaluUgandaUkraineUnited Arab EmiratesUnited KingdomUnited StatesUpper middle incomeUruguayUzbekistanVanuatuVenezuela, RBVietnamWest Bank and GazaWorldYemen, Rep.ZambiaZimbabwe Timeline:
This timeline shows a graph from 1976 to 2016 of Cyprus. No data until 1975. Number of actual observations by date: 41.
Source name:
World Development Indicators
Source organization:
World Bank national accounts data, and OECD National Accounts data files.
Categories, topics:
Economy & Growth
Last updated:
apr 23, 2017
Indicators value changes by year
Minimum:
289.564 mln
jan 1, 1976
Maximum:
20.272 bln
jan 1, 2012
At the date of observation
Value
Absolute change
Change from previous value
jan 1, 1976
289.564 mln
+289.564 mln
0.0%
jan 1, 1977
318.325 mln
+28.76 mln
9.93%
jan 1, 1978
410.085 mln
+91.76 mln
28.83%
jan 1, 1979
539.398 mln
+129.313 mln
31.53%
jan 1, 1980
728.662 mln
+189.264 mln
35.09%
jan 1, 1981
1.223 bln
+494.277 mln
67.83%
jan 1, 1982
1.218 bln
-5.233 mln
-0.43%
jan 1, 1983
1.293 bln
+75.016 mln
6.16%
jan 1, 1984
1.34 bln
+46.981 mln
3.63%
jan 1, 1985
1.413 bln
+73.513 mln
5.49%
jan 1, 1986
1.556 bln
+142.726 mln
10.1%
jan 1, 1987
2.012 bln
+455.574 mln
29.28%
jan 1, 1988
2.411 bln
+399.256 mln
19.85%
jan 1, 1989
2.795 bln
+384.303 mln
15.94%
jan 1, 1990
3.034 bln
+239.361 mln
8.56%
jan 1, 1991
3.758 bln
+723.612 mln
23.85%
jan 1, 1992
3.87 bln
+111.977 mln
2.98%
jan 1, 1993
4.75 bln
+879.753 mln
22.73%
jan 1, 1994
4.594 bln
-155.874 mln
-3.28%
jan 1, 1995
5.325 bln
+730.83 mln
15.91%
jan 1, 1996
6.528 bln
+1.203 bln
22.59%
jan 1, 1997
6.631 bln
+103.554 mln
1.59%
jan 1, 1998
6.588 bln
-43.454 mln
-0.66%
jan 1, 1999
7.175 bln
+587.313 mln
8.92%
jan 1, 2000
7.455 bln
+279.79 mln
3.9%
jan 1, 2001
7.106 bln
-348.796 mln
-4.68%
jan 1, 2002
7.327 bln
+220.646 mln
3.1%
jan 1, 2003
7.947 bln
+620.441 mln
8.47%
jan 1, 2004
9.818 bln
+1.871 bln
23.54%
jan 1, 2005
11.642 bln
+1.824 bln
18.58%
jan 1, 2006
12.482 bln
+839.53 mln
7.21%
jan 1, 2007
13.669 bln
+1.187 bln
9.51%
jan 1, 2008
15.915 bln
+2.246 bln
16.43%
jan 1, 2009
18.48 bln
+2.565 bln
16.12%
jan 1, 2010
18.156 bln
-324.422 mln
-1.76%
jan 1, 2011
18.215 bln
+59.355 mln
0.33%
jan 1, 2012
20.272 bln
+2.057 bln
11.29%
jan 1, 2013
18.84 bln
-1.432 bln
-7.06%
jan 1, 2014
18.497 bln
-343.616 mln
-1.82%
jan 1, 2015
17.828 bln
-669.03 mln
-3.62%
jan 1, 2016
15.004 bln
-2.823 bln
-15.84%
Ranking of countries by current statistics by years


Comments: