29
/
en
AIzaSyAYiBZKx7MnpbEhh9jyipgxe19OcubqV5w
April 1, 2024
55894
Pre-demographic dividend
PRE
false
2
1
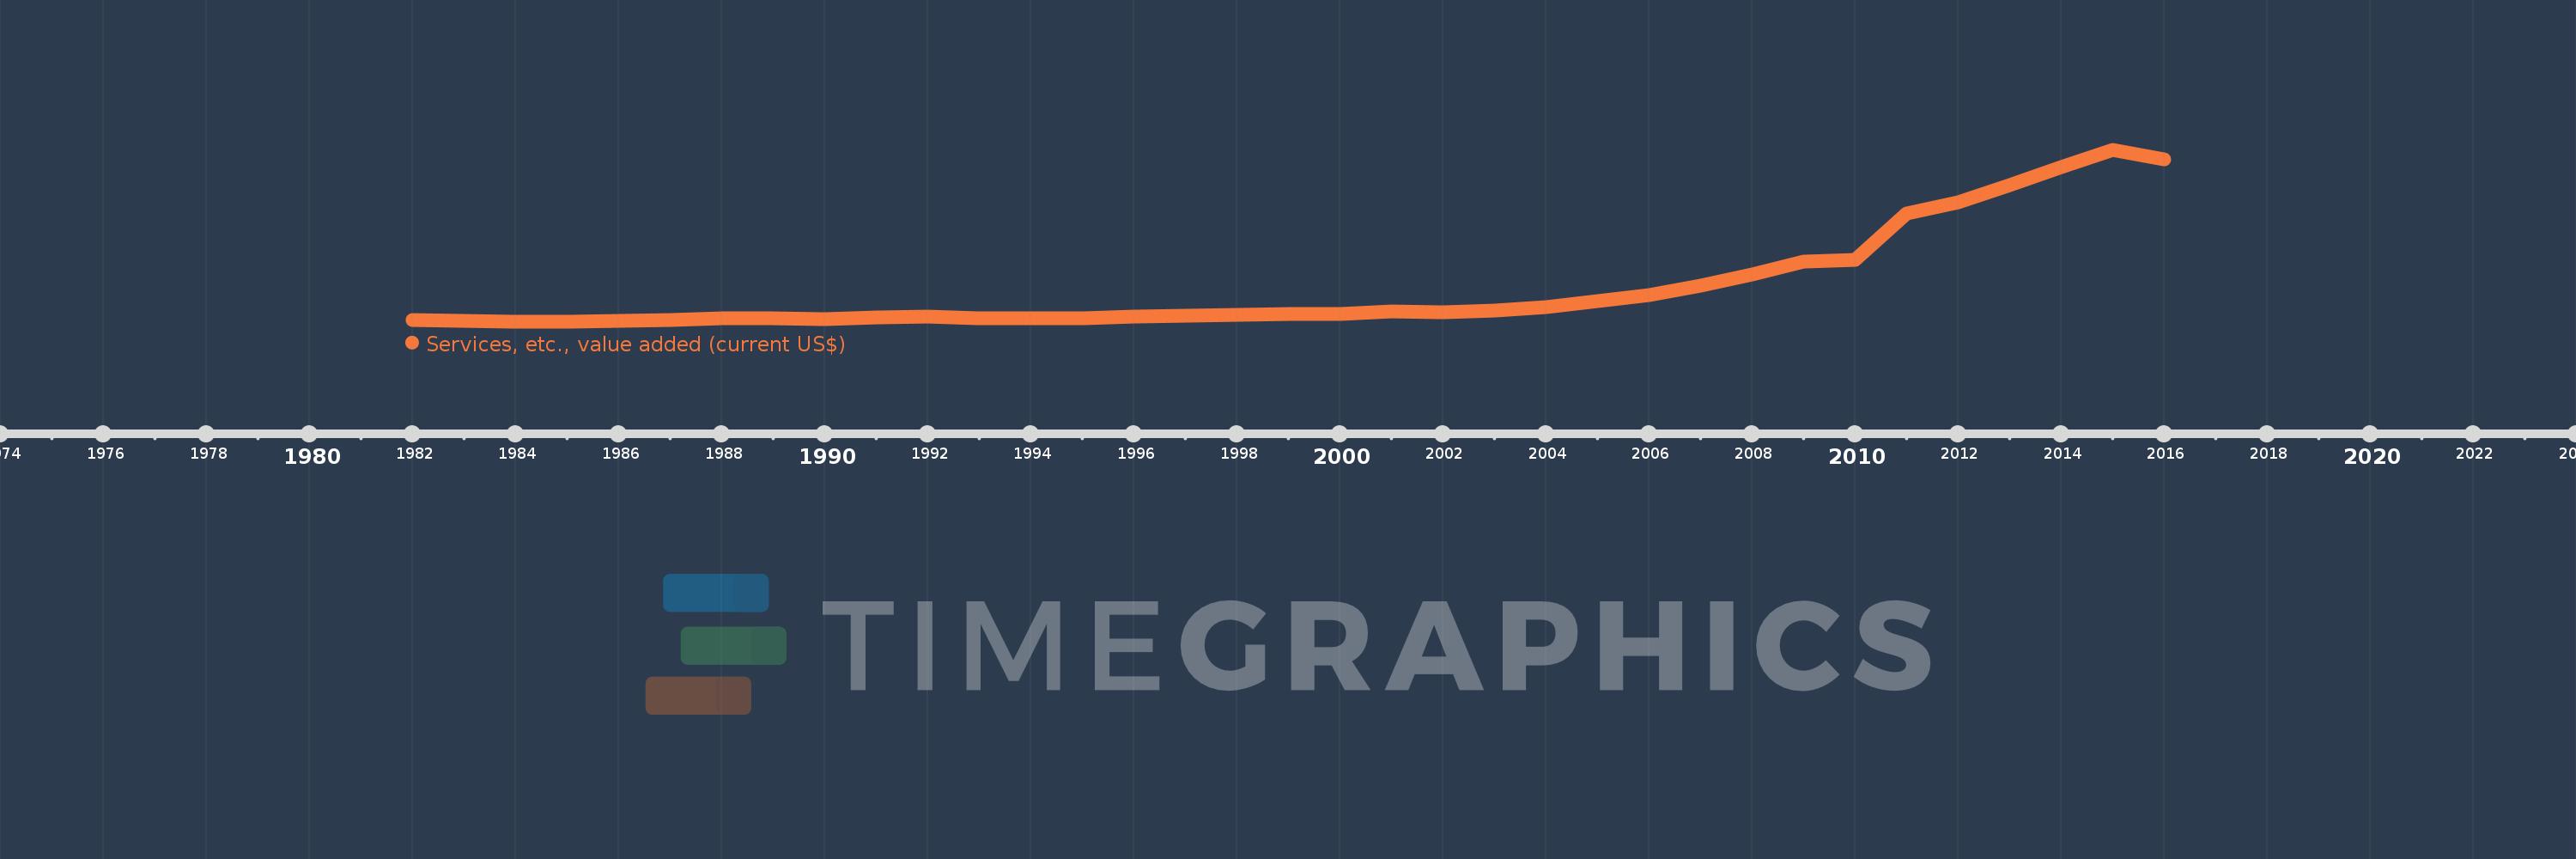
Services, etc., value added (current US$)
2016,2015,2014,2013,2012,2011,2010,2009,2008,2007,2006,2005,2004,2003,2002,2001,2000,1999,1998,1997,1996,1995,1994,1993,1992,1991,1990,1989,1988,1987,1986,1985,1984,1983,1982
This statistics in other country:
AfghanistanAlbaniaAlgeriaAndorraAngolaAntigua and BarbudaArab WorldArgentinaArmeniaArubaAustraliaAustriaAzerbaijanBahamas, TheBahrainBangladeshBarbadosBelarusBelgiumBelizeBeninBermudaBhutanBoliviaBosnia and HerzegovinaBotswanaBrazilBrunei DarussalamBulgariaBurkina FasoBurundiCabo VerdeCambodiaCameroonCanadaCaribbean small statesCentral African RepublicCentral Europe and the BalticsChadChileChinaColombiaComorosCongo, Dem. Rep.Congo, Rep.Costa RicaCote d'IvoireCroatiaCubaCyprusCzech RepublicDenmarkDjiboutiDominicaDominican RepublicEarly-demographic dividendEast Asia & PacificEast Asia & Pacific (excluding high income)East Asia & Pacific (IDA & IBRD countries)EcuadorEgypt, Arab Rep.El SalvadorEquatorial GuineaEritreaEstoniaEthiopiaEuro areaEurope & Central AsiaEurope & Central Asia (excluding high income)Europe & Central Asia (IDA & IBRD countries)European UnionFaroe IslandsFijiFinlandFragile and conflict affected situationsFranceGabonGambia, TheGeorgiaGermanyGhanaGreeceGrenadaGuatemalaGuineaGuinea-BissauGuyanaHeavily indebted poor countries (HIPC)High incomeHondurasHong Kong SAR, ChinaHungaryIBRD onlyIcelandIDA & IBRD totalIDA blendIDA onlyIDA totalIndiaIndonesiaIran, Islamic Rep.IraqIrelandItalyJamaicaJapanJordanKazakhstanKenyaKiribatiKorea, Rep.KosovoKuwaitKyrgyz RepublicLao PDRLate-demographic dividendLatin America & Caribbean Latin America & Caribbean (excluding high income)Latin America & the Caribbean (IDA & IBRD countries)LatviaLeast developed countries: UN classificationLebanonLesothoLiberiaLibyaLithuaniaLow & middle incomeLow incomeLower middle incomeLuxembourgMacao SAR, ChinaMacedonia, FYRMadagascarMalawiMalaysiaMaldivesMaliMaltaMarshall IslandsMauritaniaMauritiusMexicoMicronesia, Fed. Sts.Middle East & North AfricaMiddle East & North Africa (excluding high income)Middle East & North Africa (IDA & IBRD countries)Middle incomeMoldovaMongoliaMontenegroMoroccoMozambiqueMyanmarNamibiaNepalNetherlandsNew CaledoniaNew ZealandNicaraguaNigerNigeriaNorth AmericaNorwayOECD membersOmanOther small statesPacific island small statesPakistanPalauPanamaPapua New GuineaParaguayPeruPhilippinesPolandPortugalPost-demographic dividendPre-demographic dividendPuerto RicoQatarRomaniaRussian FederationRwandaSamoaSao Tome and PrincipeSaudi ArabiaSenegalSerbiaSeychellesSierra LeoneSingaporeSlovak RepublicSloveniaSmall statesSolomon IslandsSouth AfricaSouth AsiaSouth Asia (IDA & IBRD)SpainSri LankaSt. Kitts and NevisSt. LuciaSt. Vincent and the GrenadinesSub-Saharan Africa Sub-Saharan Africa (excluding high income)Sub-Saharan Africa (IDA & IBRD countries)SudanSurinameSwazilandSwedenSwitzerlandSyrian Arab RepublicTajikistanTanzaniaThailandTimor-LesteTogoTongaTrinidad and TobagoTunisiaTurkeyTurkmenistanTuvaluUgandaUkraineUnited Arab EmiratesUnited KingdomUnited StatesUpper middle incomeUruguayUzbekistanVanuatuVenezuela, RBVietnamWest Bank and GazaWorldYemen, Rep.ZambiaZimbabwe Timeline:
This timeline shows a graph from 1982 to 2016 of Pre-demographic dividend. No data until 1981. Number of actual observations by date: 35.
Source name:
World Development Indicators
Source organization:
World Bank national accounts data, and OECD National Accounts data files.
Categories, topics:
Economy & Growth
Last updated:
apr 23, 2017
Indicators value changes by year
Minimum:
41.958 bln
jan 1, 1984
Maximum:
701.995 bln
jan 1, 2015
At the date of observation
Value
Absolute change
Change from previous value
jan 1, 1982
48.056 bln
+48.056 bln
0.0%
jan 1, 1983
47.119 bln
-937.338 mln
-1.95%
jan 1, 1984
41.958 bln
-5.161 bln
-10.95%
jan 1, 1985
43.167 bln
+1.209 bln
2.88%
jan 1, 1986
44.756 bln
+1.588 bln
3.68%
jan 1, 1987
49.479 bln
+4.723 bln
10.55%
jan 1, 1988
54.879 bln
+5.401 bln
10.92%
jan 1, 1989
54.905 bln
+25.968 mln
0.05%
jan 1, 1990
54.162 bln
-743.254 mln
-1.35%
jan 1, 1991
60.902 bln
+6.74 bln
12.44%
jan 1, 1992
61.301 bln
+398.711 mln
0.65%
jan 1, 1993
57.588 bln
-3.713 bln
-6.06%
jan 1, 1994
54.906 bln
-2.682 bln
-4.66%
jan 1, 1995
55.375 bln
+469.273 mln
0.85%
jan 1, 1996
62.957 bln
+7.581 bln
13.69%
jan 1, 1997
67.208 bln
+4.251 bln
6.75%
jan 1, 1998
69.634 bln
+2.426 bln
3.61%
jan 1, 1999
73.478 bln
+3.845 bln
5.52%
jan 1, 2000
72.321 bln
-1.157 bln
-1.58%
jan 1, 2001
81.153 bln
+8.832 bln
12.21%
jan 1, 2002
78.923 bln
-2.23 bln
-2.75%
jan 1, 2003
86.704 bln
+7.781 bln
9.86%
jan 1, 2004
100.629 bln
+13.925 bln
16.06%
jan 1, 2005
122.507 bln
+21.878 bln
21.74%
jan 1, 2006
146.389 bln
+23.881 bln
19.49%
jan 1, 2007
182.889 bln
+36.501 bln
24.93%
jan 1, 2008
225.805 bln
+42.915 bln
23.47%
jan 1, 2009
274.239 bln
+48.434 bln
21.45%
jan 1, 2010
280.369 bln
+6.13 bln
2.24%
jan 1, 2011
458.575 bln
+178.206 bln
63.56%
jan 1, 2012
500.865 bln
+42.289 bln
9.22%
jan 1, 2013
568.271 bln
+67.406 bln
13.46%
jan 1, 2014
635.887 bln
+67.616 bln
11.9%
jan 1, 2015
701.995 bln
+66.108 bln
10.4%
jan 1, 2016
667.921 bln
-34.074 bln
-4.85%
Ranking of countries by current statistics by years


Comments: