29
/
en
AIzaSyAYiBZKx7MnpbEhh9jyipgxe19OcubqV5w
April 1, 2024
213671
Nigeria
NGA
true
2
1
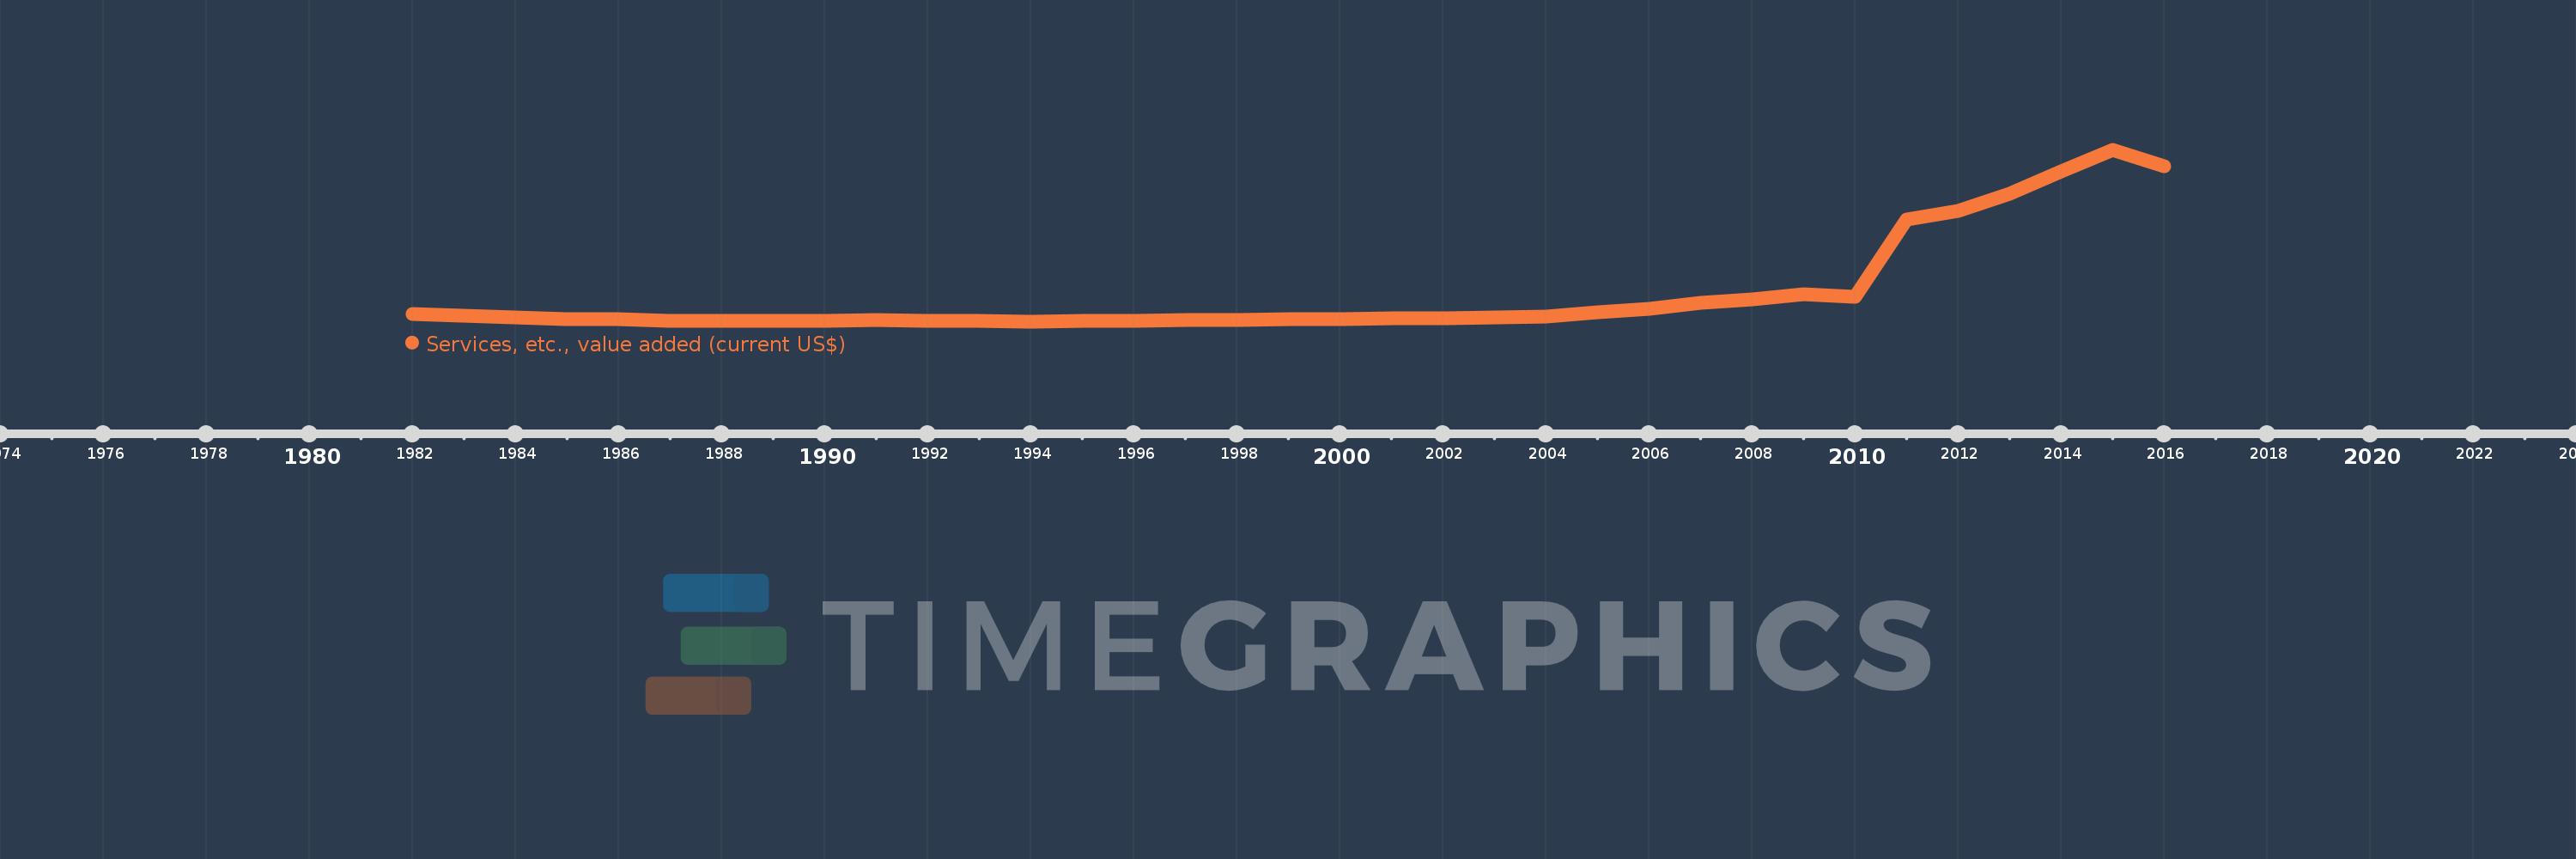
Services, etc., value added (current US$)
2016,2015,2014,2013,2012,2011,2010,2009,2008,2007,2006,2005,2004,2003,2002,2001,2000,1999,1998,1997,1996,1995,1994,1993,1992,1991,1990,1989,1988,1987,1986,1985,1984,1983,1982
This statistics in other country:
AfghanistanAlbaniaAlgeriaAndorraAngolaAntigua and BarbudaArab WorldArgentinaArmeniaArubaAustraliaAustriaAzerbaijanBahamas, TheBahrainBangladeshBarbadosBelarusBelgiumBelizeBeninBermudaBhutanBoliviaBosnia and HerzegovinaBotswanaBrazilBrunei DarussalamBulgariaBurkina FasoBurundiCabo VerdeCambodiaCameroonCanadaCaribbean small statesCentral African RepublicCentral Europe and the BalticsChadChileChinaColombiaComorosCongo, Dem. Rep.Congo, Rep.Costa RicaCote d'IvoireCroatiaCubaCyprusCzech RepublicDenmarkDjiboutiDominicaDominican RepublicEarly-demographic dividendEast Asia & PacificEast Asia & Pacific (excluding high income)East Asia & Pacific (IDA & IBRD countries)EcuadorEgypt, Arab Rep.El SalvadorEquatorial GuineaEritreaEstoniaEthiopiaEuro areaEurope & Central AsiaEurope & Central Asia (excluding high income)Europe & Central Asia (IDA & IBRD countries)European UnionFaroe IslandsFijiFinlandFragile and conflict affected situationsFranceGabonGambia, TheGeorgiaGermanyGhanaGreeceGrenadaGuatemalaGuineaGuinea-BissauGuyanaHeavily indebted poor countries (HIPC)High incomeHondurasHong Kong SAR, ChinaHungaryIBRD onlyIcelandIDA & IBRD totalIDA blendIDA onlyIDA totalIndiaIndonesiaIran, Islamic Rep.IraqIrelandItalyJamaicaJapanJordanKazakhstanKenyaKiribatiKorea, Rep.KosovoKuwaitKyrgyz RepublicLao PDRLate-demographic dividendLatin America & Caribbean Latin America & Caribbean (excluding high income)Latin America & the Caribbean (IDA & IBRD countries)LatviaLeast developed countries: UN classificationLebanonLesothoLiberiaLibyaLithuaniaLow & middle incomeLow incomeLower middle incomeLuxembourgMacao SAR, ChinaMacedonia, FYRMadagascarMalawiMalaysiaMaldivesMaliMaltaMarshall IslandsMauritaniaMauritiusMexicoMicronesia, Fed. Sts.Middle East & North AfricaMiddle East & North Africa (excluding high income)Middle East & North Africa (IDA & IBRD countries)Middle incomeMoldovaMongoliaMontenegroMoroccoMozambiqueMyanmarNamibiaNepalNetherlandsNew CaledoniaNew ZealandNicaraguaNigerNigeriaNorth AmericaNorwayOECD membersOmanOther small statesPacific island small statesPakistanPalauPanamaPapua New GuineaParaguayPeruPhilippinesPolandPortugalPost-demographic dividendPre-demographic dividendPuerto RicoQatarRomaniaRussian FederationRwandaSamoaSao Tome and PrincipeSaudi ArabiaSenegalSerbiaSeychellesSierra LeoneSingaporeSlovak RepublicSloveniaSmall statesSolomon IslandsSouth AfricaSouth AsiaSouth Asia (IDA & IBRD)SpainSri LankaSt. Kitts and NevisSt. LuciaSt. Vincent and the GrenadinesSub-Saharan Africa Sub-Saharan Africa (excluding high income)Sub-Saharan Africa (IDA & IBRD countries)SudanSurinameSwazilandSwedenSwitzerlandSyrian Arab RepublicTajikistanTanzaniaThailandTimor-LesteTogoTongaTrinidad and TobagoTunisiaTurkeyTurkmenistanTuvaluUgandaUkraineUnited Arab EmiratesUnited KingdomUnited StatesUpper middle incomeUruguayUzbekistanVanuatuVenezuela, RBVietnamWest Bank and GazaWorldYemen, Rep.ZambiaZimbabwe Timeline:
This timeline shows a graph from 1982 to 2016 of Nigeria. No data until 1981. Number of actual observations by date: 35.
Source name:
World Development Indicators
Source organization:
World Bank national accounts data, and OECD National Accounts data files.
Categories, topics:
Economy & Growth
Last updated:
apr 23, 2017
Indicators value changes by year
Minimum:
3.534 bln
jan 1, 1994
Maximum:
307.86 bln
jan 1, 2015
At the date of observation
Value
Absolute change
Change from previous value
jan 1, 1982
17.72 bln
+17.72 bln
0.0%
jan 1, 1983
15.103 bln
-2.617 bln
-14.77%
jan 1, 1984
10.932 bln
-4.171 bln
-27.62%
jan 1, 1985
8.388 bln
-2.544 bln
-23.27%
jan 1, 1986
8.247 bln
-140.675 mln
-1.68%
jan 1, 1987
6.218 bln
-2.029 bln
-24.6%
jan 1, 1988
6.215 bln
-3.037 mln
-0.05%
jan 1, 1989
5.812 bln
-403.396 mln
-6.49%
jan 1, 1990
5.576 bln
-236.339 mln
-4.07%
jan 1, 1991
6.782 bln
+1.207 bln
21.64%
jan 1, 1992
5.981 bln
-801.273 mln
-11.81%
jan 1, 1993
5.545 bln
-435.821 mln
-7.29%
jan 1, 1994
3.534 bln
-2.011 bln
-36.26%
jan 1, 1995
4.876 bln
+1.342 bln
37.97%
jan 1, 1996
6.024 bln
+1.147 bln
23.53%
jan 1, 1997
6.875 bln
+851.252 mln
14.13%
jan 1, 1998
7.539 bln
+663.944 mln
9.66%
jan 1, 1999
8.431 bln
+892.052 mln
11.83%
jan 1, 2000
9.283 bln
+851.711 mln
10.1%
jan 1, 2001
9.805 bln
+522.026 mln
5.62%
jan 1, 2002
10.779 bln
+974.434 mln
9.94%
jan 1, 2003
11.99 bln
+1.211 bln
11.24%
jan 1, 2004
13.492 bln
+1.501 bln
12.52%
jan 1, 2005
20.35 bln
+6.859 bln
50.83%
jan 1, 2006
26.349 bln
+5.999 bln
29.48%
jan 1, 2007
37.64 bln
+11.291 bln
42.85%
jan 1, 2008
43.732 bln
+6.092 bln
16.18%
jan 1, 2009
52.605 bln
+8.874 bln
20.29%
jan 1, 2010
47.864 bln
-4.742 bln
-9.01%
jan 1, 2011
184.546 bln
+136.682 bln
285.56%
jan 1, 2012
200.914 bln
+16.367 bln
8.87%
jan 1, 2013
230.543 bln
+29.629 bln
14.75%
jan 1, 2014
269.67 bln
+39.127 bln
16.97%
jan 1, 2015
307.86 bln
+38.19 bln
14.16%
jan 1, 2016
279.606 bln
-28.254 bln
-9.18%
Ranking of countries by current statistics by years


Comments: