29
/
en
AIzaSyAYiBZKx7MnpbEhh9jyipgxe19OcubqV5w
April 1, 2024
116246
Cuba
CUB
true
2
1
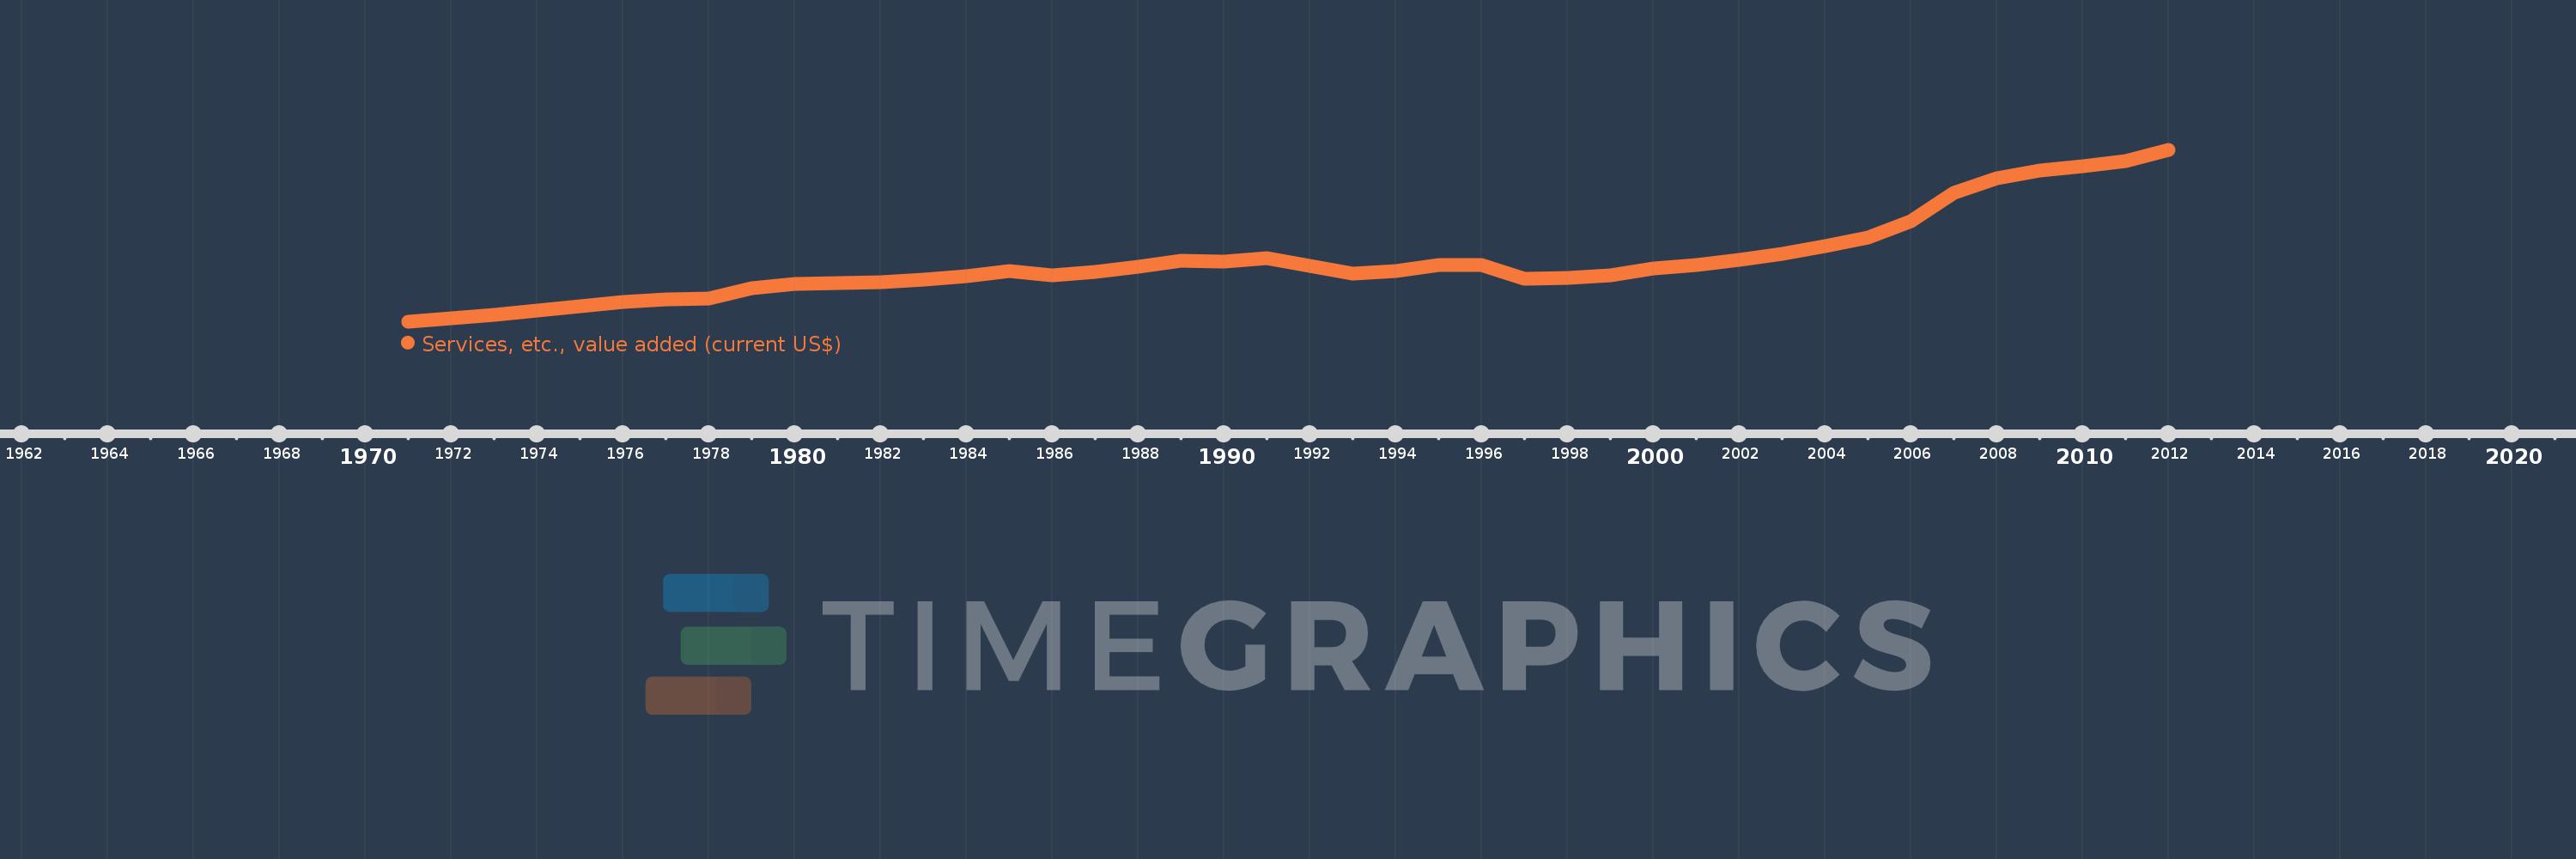
Services, etc., value added (current US$)
2012,2011,2010,2009,2008,2007,2006,2005,2004,2003,2002,2001,2000,1999,1998,1997,1996,1995,1994,1993,1992,1991,1990,1989,1988,1987,1986,1985,1984,1983,1982,1981,1980,1979,1978,1977,1976,1975,1974,1973,1972,1971
This statistics in other country:
AfghanistanAlbaniaAlgeriaAndorraAngolaAntigua and BarbudaArab WorldArgentinaArmeniaArubaAustraliaAustriaAzerbaijanBahamas, TheBahrainBangladeshBarbadosBelarusBelgiumBelizeBeninBermudaBhutanBoliviaBosnia and HerzegovinaBotswanaBrazilBrunei DarussalamBulgariaBurkina FasoBurundiCabo VerdeCambodiaCameroonCanadaCaribbean small statesCentral African RepublicCentral Europe and the BalticsChadChileChinaColombiaComorosCongo, Dem. Rep.Congo, Rep.Costa RicaCote d'IvoireCroatiaCubaCyprusCzech RepublicDenmarkDjiboutiDominicaDominican RepublicEarly-demographic dividendEast Asia & PacificEast Asia & Pacific (excluding high income)East Asia & Pacific (IDA & IBRD countries)EcuadorEgypt, Arab Rep.El SalvadorEquatorial GuineaEritreaEstoniaEthiopiaEuro areaEurope & Central AsiaEurope & Central Asia (excluding high income)Europe & Central Asia (IDA & IBRD countries)European UnionFaroe IslandsFijiFinlandFragile and conflict affected situationsFranceGabonGambia, TheGeorgiaGermanyGhanaGreeceGrenadaGuatemalaGuineaGuinea-BissauGuyanaHeavily indebted poor countries (HIPC)High incomeHondurasHong Kong SAR, ChinaHungaryIBRD onlyIcelandIDA & IBRD totalIDA blendIDA onlyIDA totalIndiaIndonesiaIran, Islamic Rep.IraqIrelandItalyJamaicaJapanJordanKazakhstanKenyaKiribatiKorea, Rep.KosovoKuwaitKyrgyz RepublicLao PDRLate-demographic dividendLatin America & Caribbean Latin America & Caribbean (excluding high income)Latin America & the Caribbean (IDA & IBRD countries)LatviaLeast developed countries: UN classificationLebanonLesothoLiberiaLibyaLithuaniaLow & middle incomeLow incomeLower middle incomeLuxembourgMacao SAR, ChinaMacedonia, FYRMadagascarMalawiMalaysiaMaldivesMaliMaltaMarshall IslandsMauritaniaMauritiusMexicoMicronesia, Fed. Sts.Middle East & North AfricaMiddle East & North Africa (excluding high income)Middle East & North Africa (IDA & IBRD countries)Middle incomeMoldovaMongoliaMontenegroMoroccoMozambiqueMyanmarNamibiaNepalNetherlandsNew CaledoniaNew ZealandNicaraguaNigerNigeriaNorth AmericaNorwayOECD membersOmanOther small statesPacific island small statesPakistanPalauPanamaPapua New GuineaParaguayPeruPhilippinesPolandPortugalPost-demographic dividendPre-demographic dividendPuerto RicoQatarRomaniaRussian FederationRwandaSamoaSao Tome and PrincipeSaudi ArabiaSenegalSerbiaSeychellesSierra LeoneSingaporeSlovak RepublicSloveniaSmall statesSolomon IslandsSouth AfricaSouth AsiaSouth Asia (IDA & IBRD)SpainSri LankaSt. Kitts and NevisSt. LuciaSt. Vincent and the GrenadinesSub-Saharan Africa Sub-Saharan Africa (excluding high income)Sub-Saharan Africa (IDA & IBRD countries)SudanSurinameSwazilandSwedenSwitzerlandSyrian Arab RepublicTajikistanTanzaniaThailandTimor-LesteTogoTongaTrinidad and TobagoTunisiaTurkeyTurkmenistanTuvaluUgandaUkraineUnited Arab EmiratesUnited KingdomUnited StatesUpper middle incomeUruguayUzbekistanVanuatuVenezuela, RBVietnamWest Bank and GazaWorldYemen, Rep.ZambiaZimbabwe Timeline:
This timeline shows a graph from 1971 to 2012 of Cuba. No data until 1970. Number of actual observations by date: 42.
Source name:
World Development Indicators
Source organization:
World Bank national accounts data, and OECD National Accounts data files.
Categories, topics:
Economy & Growth
Last updated:
apr 23, 2017
Indicators value changes by year
Minimum:
3.523 bln
jan 1, 1971
Maximum:
42.194 bln
jan 1, 2012
At the date of observation
Value
Absolute change
Change from previous value
jan 1, 1971
3.523 bln
+3.523 bln
0.0%
jan 1, 1972
4.279 bln
+755.627 mln
21.45%
jan 1, 1973
5.034 bln
+755.146 mln
17.65%
jan 1, 1974
6.181 bln
+1.147 bln
22.78%
jan 1, 1975
7.06 bln
+879.492 mln
14.23%
jan 1, 1976
8.062 bln
+1.001 bln
14.18%
jan 1, 1977
8.529 bln
+467.255 mln
5.8%
jan 1, 1978
8.79 bln
+260.784 mln
3.06%
jan 1, 1979
11.048 bln
+2.259 bln
25.7%
jan 1, 1980
12.138 bln
+1.09 bln
9.87%
jan 1, 1981
12.305 bln
+166.806 mln
1.37%
jan 1, 1982
12.431 bln
+125.766 mln
1.02%
jan 1, 1983
12.988 bln
+556.588 mln
4.48%
jan 1, 1984
13.795 bln
+807.32 mln
6.22%
jan 1, 1985
14.978 bln
+1.183 bln
8.58%
jan 1, 1986
13.953 bln
-1.025 bln
-6.85%
jan 1, 1987
14.82 bln
+867.036 mln
6.21%
jan 1, 1988
15.995 bln
+1.176 bln
7.93%
jan 1, 1989
17.251 bln
+1.256 bln
7.85%
jan 1, 1990
17.087 bln
-164.511 mln
-0.95%
jan 1, 1991
17.984 bln
+897.857 mln
5.25%
jan 1, 1992
16.099 bln
-1.886 bln
-10.48%
jan 1, 1993
14.44 bln
-1.659 bln
-10.31%
jan 1, 1994
15.069 bln
+629.339 mln
4.36%
jan 1, 1995
16.387 bln
+1.318 bln
8.75%
jan 1, 1996
16.332 bln
-55.348 mln
-0.34%
jan 1, 1997
13.208 bln
-3.123 bln
-19.13%
jan 1, 1998
13.454 bln
+245.2 mln
1.86%
jan 1, 1999
14.065 bln
+611.3 mln
4.54%
jan 1, 2000
15.569 bln
+1.504 bln
10.69%
jan 1, 2001
16.407 bln
+837.9 mln
5.38%
jan 1, 2002
17.58 bln
+1.173 bln
7.15%
jan 1, 2003
18.933 bln
+1.353 bln
7.7%
jan 1, 2004
20.675 bln
+1.742 bln
9.2%
jan 1, 2005
22.465 bln
+1.79 bln
8.66%
jan 1, 2006
26.181 bln
+3.717 bln
16.54%
jan 1, 2007
32.628 bln
+6.446 bln
24.62%
jan 1, 2008
35.831 bln
+3.203 bln
9.82%
jan 1, 2009
37.518 bln
+1.687 bln
4.71%
jan 1, 2010
38.581 bln
+1.063 bln
2.83%
jan 1, 2011
39.667 bln
+1.086 bln
2.82%
jan 1, 2012
42.194 bln
+2.527 bln
6.37%
Ranking of countries by current statistics by years


Comments: