29
/
en
AIzaSyAYiBZKx7MnpbEhh9jyipgxe19OcubqV5w
April 1, 2024
32196
Europe & Central Asia (excluding high income)
ECA
false
2
1
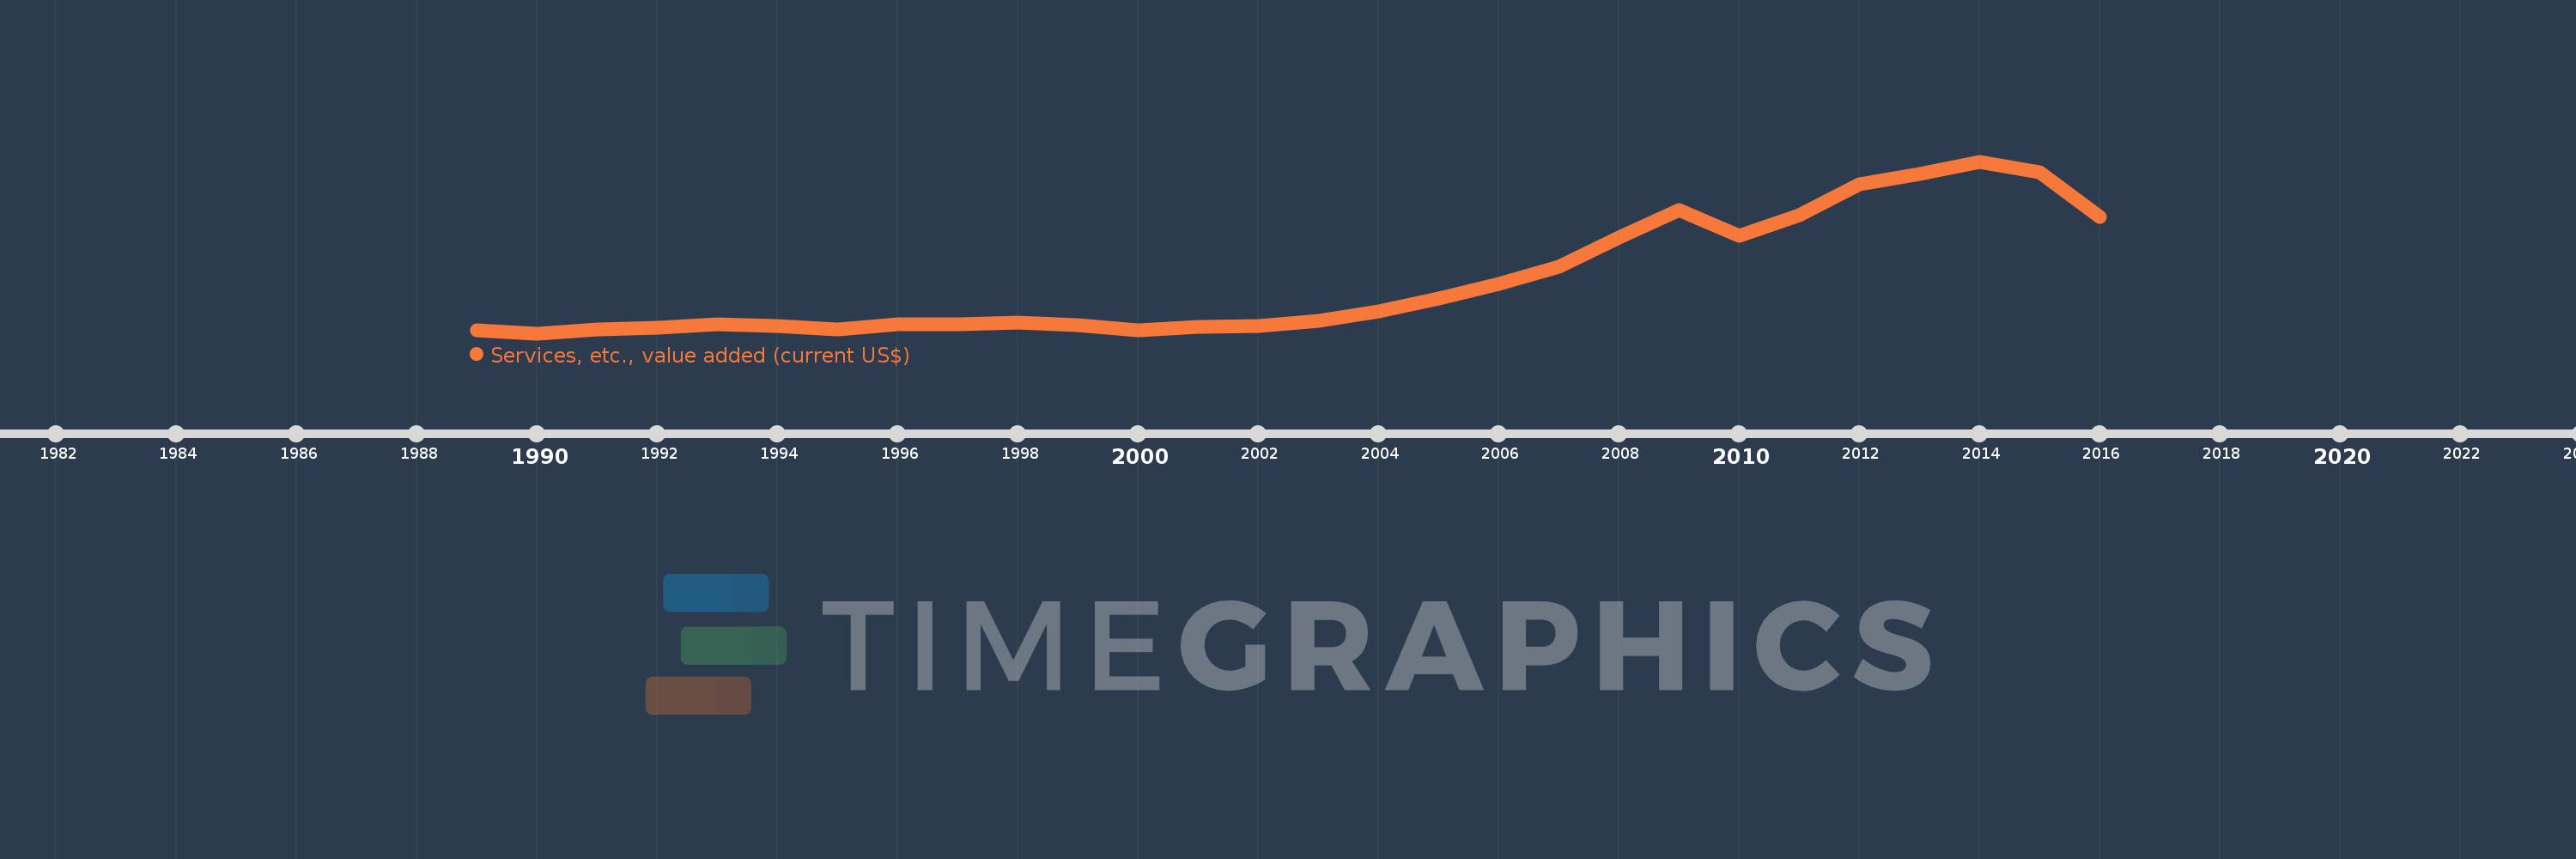
Services, etc., value added (current US$)
2016,2015,2014,2013,2012,2011,2010,2009,2008,2007,2006,2005,2004,2003,2002,2001,2000,1999,1998,1997,1996,1995,1994,1993,1992,1991,1990,1989
This statistics in other country:
AfghanistanAlbaniaAlgeriaAndorraAngolaAntigua and BarbudaArab WorldArgentinaArmeniaArubaAustraliaAustriaAzerbaijanBahamas, TheBahrainBangladeshBarbadosBelarusBelgiumBelizeBeninBermudaBhutanBoliviaBosnia and HerzegovinaBotswanaBrazilBrunei DarussalamBulgariaBurkina FasoBurundiCabo VerdeCambodiaCameroonCanadaCaribbean small statesCentral African RepublicCentral Europe and the BalticsChadChileChinaColombiaComorosCongo, Dem. Rep.Congo, Rep.Costa RicaCote d'IvoireCroatiaCubaCyprusCzech RepublicDenmarkDjiboutiDominicaDominican RepublicEarly-demographic dividendEast Asia & PacificEast Asia & Pacific (excluding high income)East Asia & Pacific (IDA & IBRD countries)EcuadorEgypt, Arab Rep.El SalvadorEquatorial GuineaEritreaEstoniaEthiopiaEuro areaEurope & Central AsiaEurope & Central Asia (excluding high income)Europe & Central Asia (IDA & IBRD countries)European UnionFaroe IslandsFijiFinlandFragile and conflict affected situationsFranceGabonGambia, TheGeorgiaGermanyGhanaGreeceGrenadaGuatemalaGuineaGuinea-BissauGuyanaHeavily indebted poor countries (HIPC)High incomeHondurasHong Kong SAR, ChinaHungaryIBRD onlyIcelandIDA & IBRD totalIDA blendIDA onlyIDA totalIndiaIndonesiaIran, Islamic Rep.IraqIrelandItalyJamaicaJapanJordanKazakhstanKenyaKiribatiKorea, Rep.KosovoKuwaitKyrgyz RepublicLao PDRLate-demographic dividendLatin America & Caribbean Latin America & Caribbean (excluding high income)Latin America & the Caribbean (IDA & IBRD countries)LatviaLeast developed countries: UN classificationLebanonLesothoLiberiaLibyaLithuaniaLow & middle incomeLow incomeLower middle incomeLuxembourgMacao SAR, ChinaMacedonia, FYRMadagascarMalawiMalaysiaMaldivesMaliMaltaMarshall IslandsMauritaniaMauritiusMexicoMicronesia, Fed. Sts.Middle East & North AfricaMiddle East & North Africa (excluding high income)Middle East & North Africa (IDA & IBRD countries)Middle incomeMoldovaMongoliaMontenegroMoroccoMozambiqueMyanmarNamibiaNepalNetherlandsNew CaledoniaNew ZealandNicaraguaNigerNigeriaNorth AmericaNorwayOECD membersOmanOther small statesPacific island small statesPakistanPalauPanamaPapua New GuineaParaguayPeruPhilippinesPolandPortugalPost-demographic dividendPre-demographic dividendPuerto RicoQatarRomaniaRussian FederationRwandaSamoaSao Tome and PrincipeSaudi ArabiaSenegalSerbiaSeychellesSierra LeoneSingaporeSlovak RepublicSloveniaSmall statesSolomon IslandsSouth AfricaSouth AsiaSouth Asia (IDA & IBRD)SpainSri LankaSt. Kitts and NevisSt. LuciaSt. Vincent and the GrenadinesSub-Saharan Africa Sub-Saharan Africa (excluding high income)Sub-Saharan Africa (IDA & IBRD countries)SudanSurinameSwazilandSwedenSwitzerlandSyrian Arab RepublicTajikistanTanzaniaThailandTimor-LesteTogoTongaTrinidad and TobagoTunisiaTurkeyTurkmenistanTuvaluUgandaUkraineUnited Arab EmiratesUnited KingdomUnited StatesUpper middle incomeUruguayUzbekistanVanuatuVenezuela, RBVietnamWest Bank and GazaWorldYemen, Rep.ZambiaZimbabwe Timeline:
This timeline shows a graph from 1989 to 2016 of Europe & Central Asia (excluding high income). No data until 1988. Number of actual observations by date: 28.
Source name:
World Development Indicators
Source organization:
World Bank national accounts data, and OECD National Accounts data files.
Categories, topics:
Economy & Growth
Last updated:
apr 23, 2017
Indicators value changes by year
Minimum:
265.505 bln
jan 1, 1990
Maximum:
2.225 trl
jan 1, 2014
At the date of observation
Value
Absolute change
Change from previous value
jan 1, 1989
296.07 bln
+296.07 bln
0.0%
jan 1, 1990
265.505 bln
-30.565 bln
-10.32%
jan 1, 1991
308.965 bln
+43.46 bln
16.37%
jan 1, 1992
329.47 bln
+20.505 bln
6.64%
jan 1, 1993
369.47 bln
+40.0 bln
12.14%
jan 1, 1994
352.108 bln
-17.362 bln
-4.7%
jan 1, 1995
304.834 bln
-47.274 bln
-13.43%
jan 1, 1996
366.037 bln
+61.204 bln
20.08%
jan 1, 1997
365.2 bln
-837.175 mln
-0.23%
jan 1, 1998
390.15 bln
+24.95 bln
6.83%
jan 1, 1999
355.223 bln
-34.927 bln
-8.95%
jan 1, 2000
300.326 bln
-54.897 bln
-15.45%
jan 1, 2001
339.264 bln
+38.938 bln
12.97%
jan 1, 2002
345.48 bln
+6.215 bln
1.83%
jan 1, 2003
404.104 bln
+58.624 bln
16.97%
jan 1, 2004
511.548 bln
+107.444 bln
26.59%
jan 1, 2005
659.859 bln
+148.311 bln
28.99%
jan 1, 2006
825.291 bln
+165.432 bln
25.07%
jan 1, 2007
1.028 trl
+202.562 bln
24.54%
jan 1, 2008
1.359 trl
+331.428 bln
32.24%
jan 1, 2009
1.675 trl
+315.303 bln
23.2%
jan 1, 2010
1.377 trl
-297.17 bln
-17.75%
jan 1, 2011
1.61 trl
+232.554 bln
16.88%
jan 1, 2012
1.968 trl
+358.499 bln
22.27%
jan 1, 2013
2.086 trl
+117.413 bln
5.96%
jan 1, 2014
2.225 trl
+139.574 bln
6.69%
jan 1, 2015
2.099 trl
-126.148 bln
-5.67%
jan 1, 2016
1.593 trl
-506.124 bln
-24.11%
Ranking of countries by current statistics by years


Comments: