29
/
en
AIzaSyAYiBZKx7MnpbEhh9jyipgxe19OcubqV5w
April 1, 2024
224310
Philippines
PHL
true
2
1
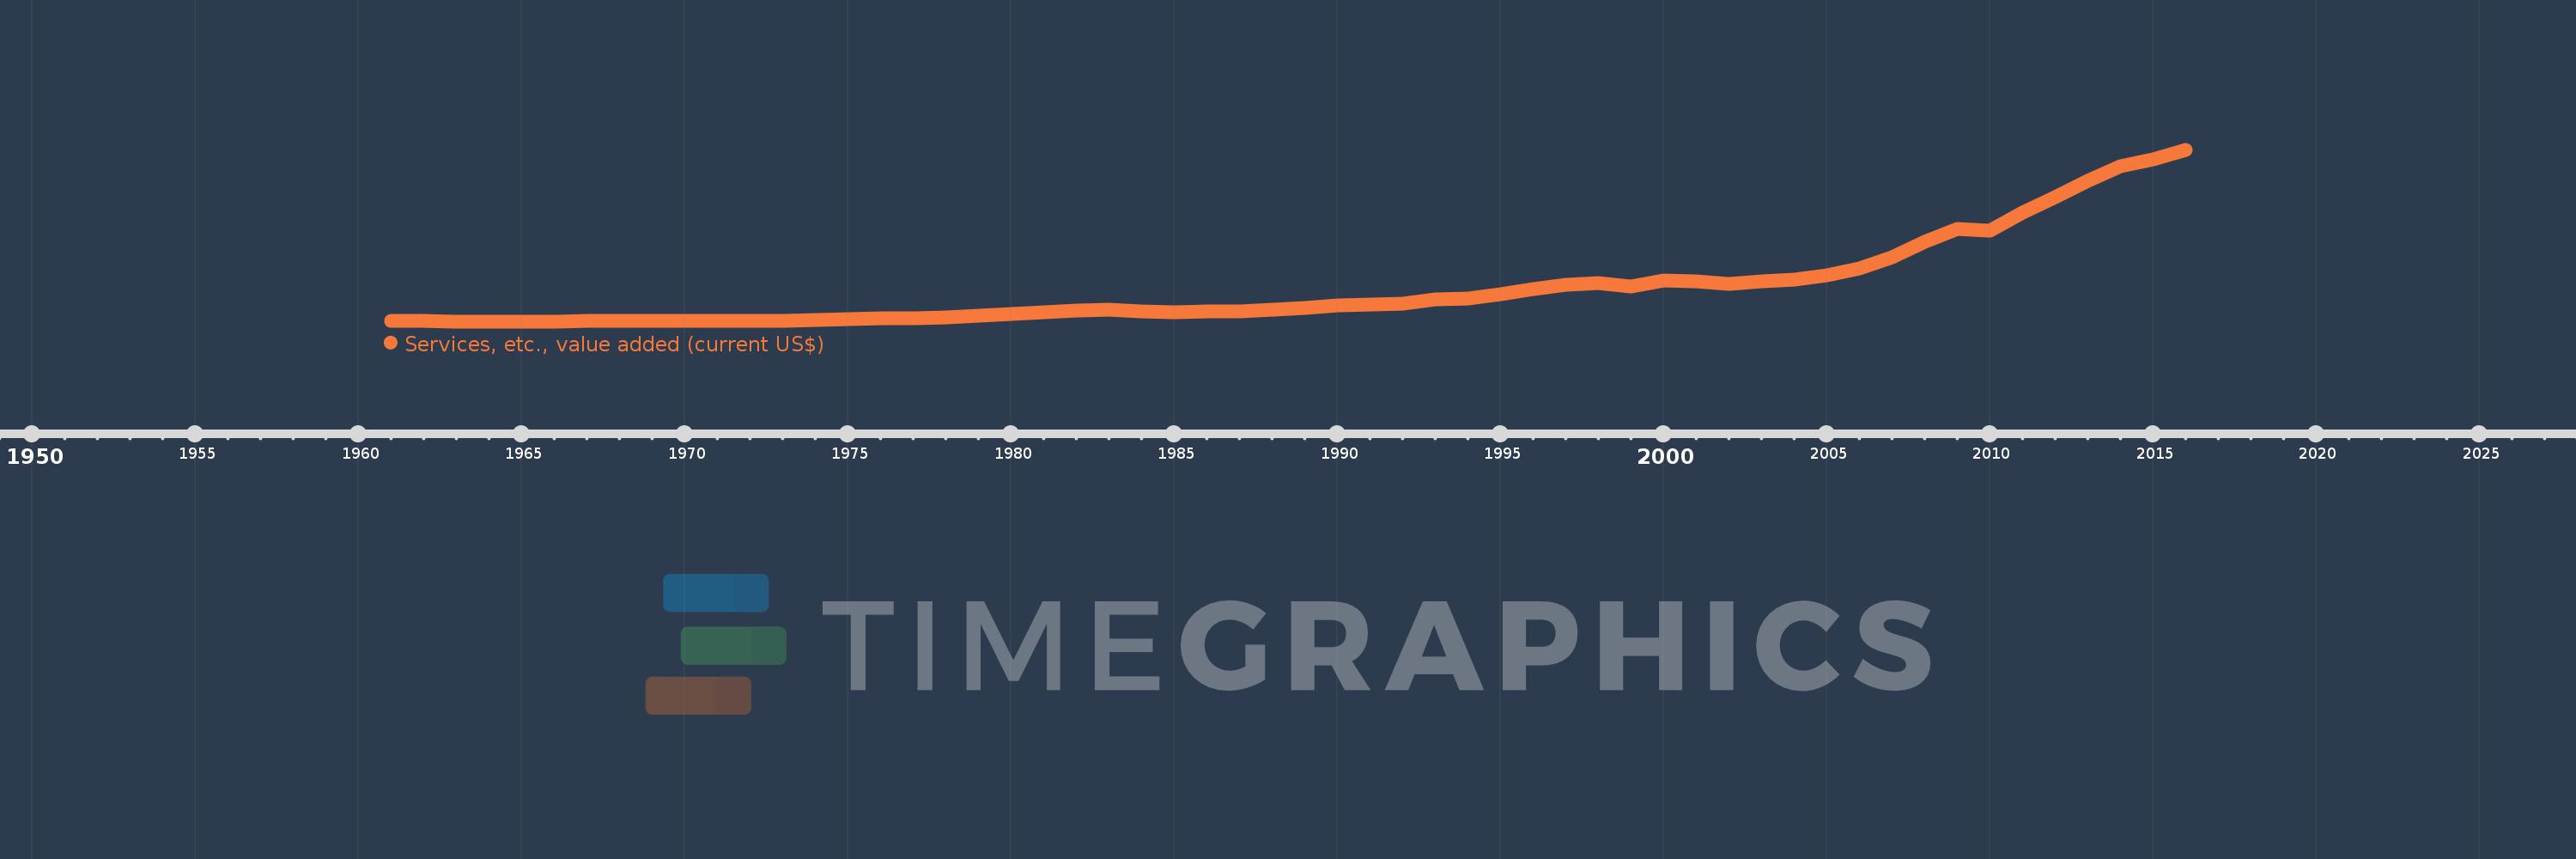
Services, etc., value added (current US$)
2016,2015,2014,2013,2012,2011,2010,2009,2008,2007,2006,2005,2004,2003,2002,2001,2000,1999,1998,1997,1996,1995,1994,1993,1992,1991,1990,1989,1988,1987,1986,1985,1984,1983,1982,1981,1980,1979,1978,1977,1976,1975,1974,1973,1972,1971,1970,1969,1968,1967,1966,1965,1964,1963,1962,1961
This statistics in other country:
AfghanistanAlbaniaAlgeriaAndorraAngolaAntigua and BarbudaArab WorldArgentinaArmeniaArubaAustraliaAustriaAzerbaijanBahamas, TheBahrainBangladeshBarbadosBelarusBelgiumBelizeBeninBermudaBhutanBoliviaBosnia and HerzegovinaBotswanaBrazilBrunei DarussalamBulgariaBurkina FasoBurundiCabo VerdeCambodiaCameroonCanadaCaribbean small statesCentral African RepublicCentral Europe and the BalticsChadChileChinaColombiaComorosCongo, Dem. Rep.Congo, Rep.Costa RicaCote d'IvoireCroatiaCubaCyprusCzech RepublicDenmarkDjiboutiDominicaDominican RepublicEarly-demographic dividendEast Asia & PacificEast Asia & Pacific (excluding high income)East Asia & Pacific (IDA & IBRD countries)EcuadorEgypt, Arab Rep.El SalvadorEquatorial GuineaEritreaEstoniaEthiopiaEuro areaEurope & Central AsiaEurope & Central Asia (excluding high income)Europe & Central Asia (IDA & IBRD countries)European UnionFaroe IslandsFijiFinlandFragile and conflict affected situationsFranceGabonGambia, TheGeorgiaGermanyGhanaGreeceGrenadaGuatemalaGuineaGuinea-BissauGuyanaHeavily indebted poor countries (HIPC)High incomeHondurasHong Kong SAR, ChinaHungaryIBRD onlyIcelandIDA & IBRD totalIDA blendIDA onlyIDA totalIndiaIndonesiaIran, Islamic Rep.IraqIrelandItalyJamaicaJapanJordanKazakhstanKenyaKiribatiKorea, Rep.KosovoKuwaitKyrgyz RepublicLao PDRLate-demographic dividendLatin America & Caribbean Latin America & Caribbean (excluding high income)Latin America & the Caribbean (IDA & IBRD countries)LatviaLeast developed countries: UN classificationLebanonLesothoLiberiaLibyaLithuaniaLow & middle incomeLow incomeLower middle incomeLuxembourgMacao SAR, ChinaMacedonia, FYRMadagascarMalawiMalaysiaMaldivesMaliMaltaMarshall IslandsMauritaniaMauritiusMexicoMicronesia, Fed. Sts.Middle East & North AfricaMiddle East & North Africa (excluding high income)Middle East & North Africa (IDA & IBRD countries)Middle incomeMoldovaMongoliaMontenegroMoroccoMozambiqueMyanmarNamibiaNepalNetherlandsNew CaledoniaNew ZealandNicaraguaNigerNigeriaNorth AmericaNorwayOECD membersOmanOther small statesPacific island small statesPakistanPalauPanamaPapua New GuineaParaguayPeruPhilippinesPolandPortugalPost-demographic dividendPre-demographic dividendPuerto RicoQatarRomaniaRussian FederationRwandaSamoaSao Tome and PrincipeSaudi ArabiaSenegalSerbiaSeychellesSierra LeoneSingaporeSlovak RepublicSloveniaSmall statesSolomon IslandsSouth AfricaSouth AsiaSouth Asia (IDA & IBRD)SpainSri LankaSt. Kitts and NevisSt. LuciaSt. Vincent and the GrenadinesSub-Saharan Africa Sub-Saharan Africa (excluding high income)Sub-Saharan Africa (IDA & IBRD countries)SudanSurinameSwazilandSwedenSwitzerlandSyrian Arab RepublicTajikistanTanzaniaThailandTimor-LesteTogoTongaTrinidad and TobagoTunisiaTurkeyTurkmenistanTuvaluUgandaUkraineUnited Arab EmiratesUnited KingdomUnited StatesUpper middle incomeUruguayUzbekistanVanuatuVenezuela, RBVietnamWest Bank and GazaWorldYemen, Rep.ZambiaZimbabwe Timeline:
This timeline shows a graph from 1961 to 2016 of Philippines. No data until 1960. Number of actual observations by date: 56.
Source name:
World Development Indicators
Source organization:
World Bank national accounts data, and OECD National Accounts data files.
Categories, topics:
Economy & Growth
Last updated:
apr 23, 2017
Indicators value changes by year
Minimum:
1.851 bln
jan 1, 1963
Maximum:
172.438 bln
jan 1, 2016
At the date of observation
Value
Absolute change
Change from previous value
jan 1, 1961
2.794 bln
+2.794 bln
0.0%
jan 1, 1962
3.017 bln
+223.519 mln
8.0%
jan 1, 1963
1.851 bln
-1.166 bln
-38.66%
jan 1, 1964
2.0 bln
+148.911 mln
8.05%
jan 1, 1965
2.221 bln
+221.485 mln
11.08%
jan 1, 1966
2.414 bln
+193.235 mln
8.7%
jan 1, 1967
2.671 bln
+256.374 mln
10.62%
jan 1, 1968
2.8 bln
+129.722 mln
4.86%
jan 1, 1969
3.052 bln
+251.49 mln
8.98%
jan 1, 1970
3.353 bln
+301.262 mln
9.87%
jan 1, 1971
2.581 bln
-772.47 mln
-23.04%
jan 1, 1972
2.766 bln
+184.976 mln
7.17%
jan 1, 1973
2.969 bln
+203.102 mln
7.34%
jan 1, 1974
3.561 bln
+592.639 mln
19.96%
jan 1, 1975
4.748 bln
+1.186 bln
33.31%
jan 1, 1976
5.162 bln
+414.61 mln
8.73%
jan 1, 1977
5.912 bln
+750.073 mln
14.53%
jan 1, 1978
6.768 bln
+855.584 mln
14.47%
jan 1, 1979
7.926 bln
+1.158 bln
17.11%
jan 1, 1980
9.649 bln
+1.723 bln
21.74%
jan 1, 1981
11.714 bln
+2.064 bln
21.4%
jan 1, 1982
12.81 bln
+1.096 bln
9.36%
jan 1, 1983
14.048 bln
+1.238 bln
9.66%
jan 1, 1984
12.754 bln
-1.294 bln
-9.21%
jan 1, 1985
11.728 bln
-1.026 bln
-8.05%
jan 1, 1986
12.403 bln
+674.974 mln
5.76%
jan 1, 1987
12.389 bln
-14.029 mln
-0.11%
jan 1, 1988
13.796 bln
+1.407 bln
11.36%
jan 1, 1989
15.867 bln
+2.071 bln
15.02%
jan 1, 1990
18.056 bln
+2.189 bln
13.79%
jan 1, 1991
19.33 bln
+1.275 bln
7.06%
jan 1, 1992
20.439 bln
+1.109 bln
5.74%
jan 1, 1993
24.021 bln
+3.581 bln
17.52%
jan 1, 1994
24.853 bln
+832.466 mln
3.47%
jan 1, 1995
29.137 bln
+4.284 bln
17.24%
jan 1, 1996
34.325 bln
+5.188 bln
17.81%
jan 1, 1997
39.184 bln
+4.859 bln
14.15%
jan 1, 1998
40.344 bln
+1.16 bln
2.96%
jan 1, 1999
36.717 bln
-3.627 bln
-8.99%
jan 1, 2000
42.936 bln
+6.219 bln
16.94%
jan 1, 2001
41.791 bln
-1.145 bln
-2.67%
jan 1, 2002
39.884 bln
-1.907 bln
-4.56%
jan 1, 2003
42.526 bln
+2.642 bln
6.63%
jan 1, 2004
44.249 bln
+1.723 bln
4.05%
jan 1, 2005
48.374 bln
+4.125 bln
9.32%
jan 1, 2006
55.144 bln
+6.771 bln
14.0%
jan 1, 2007
66.163 bln
+11.018 bln
19.98%
jan 1, 2008
81.327 bln
+15.164 bln
22.92%
jan 1, 2009
93.854 bln
+12.527 bln
15.4%
jan 1, 2010
92.936 bln
-918.11 mln
-0.98%
jan 1, 2011
110.009 bln
+17.073 bln
18.37%
jan 1, 2012
125.367 bln
+15.358 bln
13.96%
jan 1, 2013
142.352 bln
+16.985 bln
13.55%
jan 1, 2014
156.664 bln
+14.311 bln
10.05%
jan 1, 2015
163.423 bln
+6.759 bln
4.31%
jan 1, 2016
172.438 bln
+9.015 bln
5.52%
Ranking of countries by current statistics by years


Comments: