29
/
en
AIzaSyAYiBZKx7MnpbEhh9jyipgxe19OcubqV5w
April 1, 2024
124212
Ecuador
ECU
true
2
1
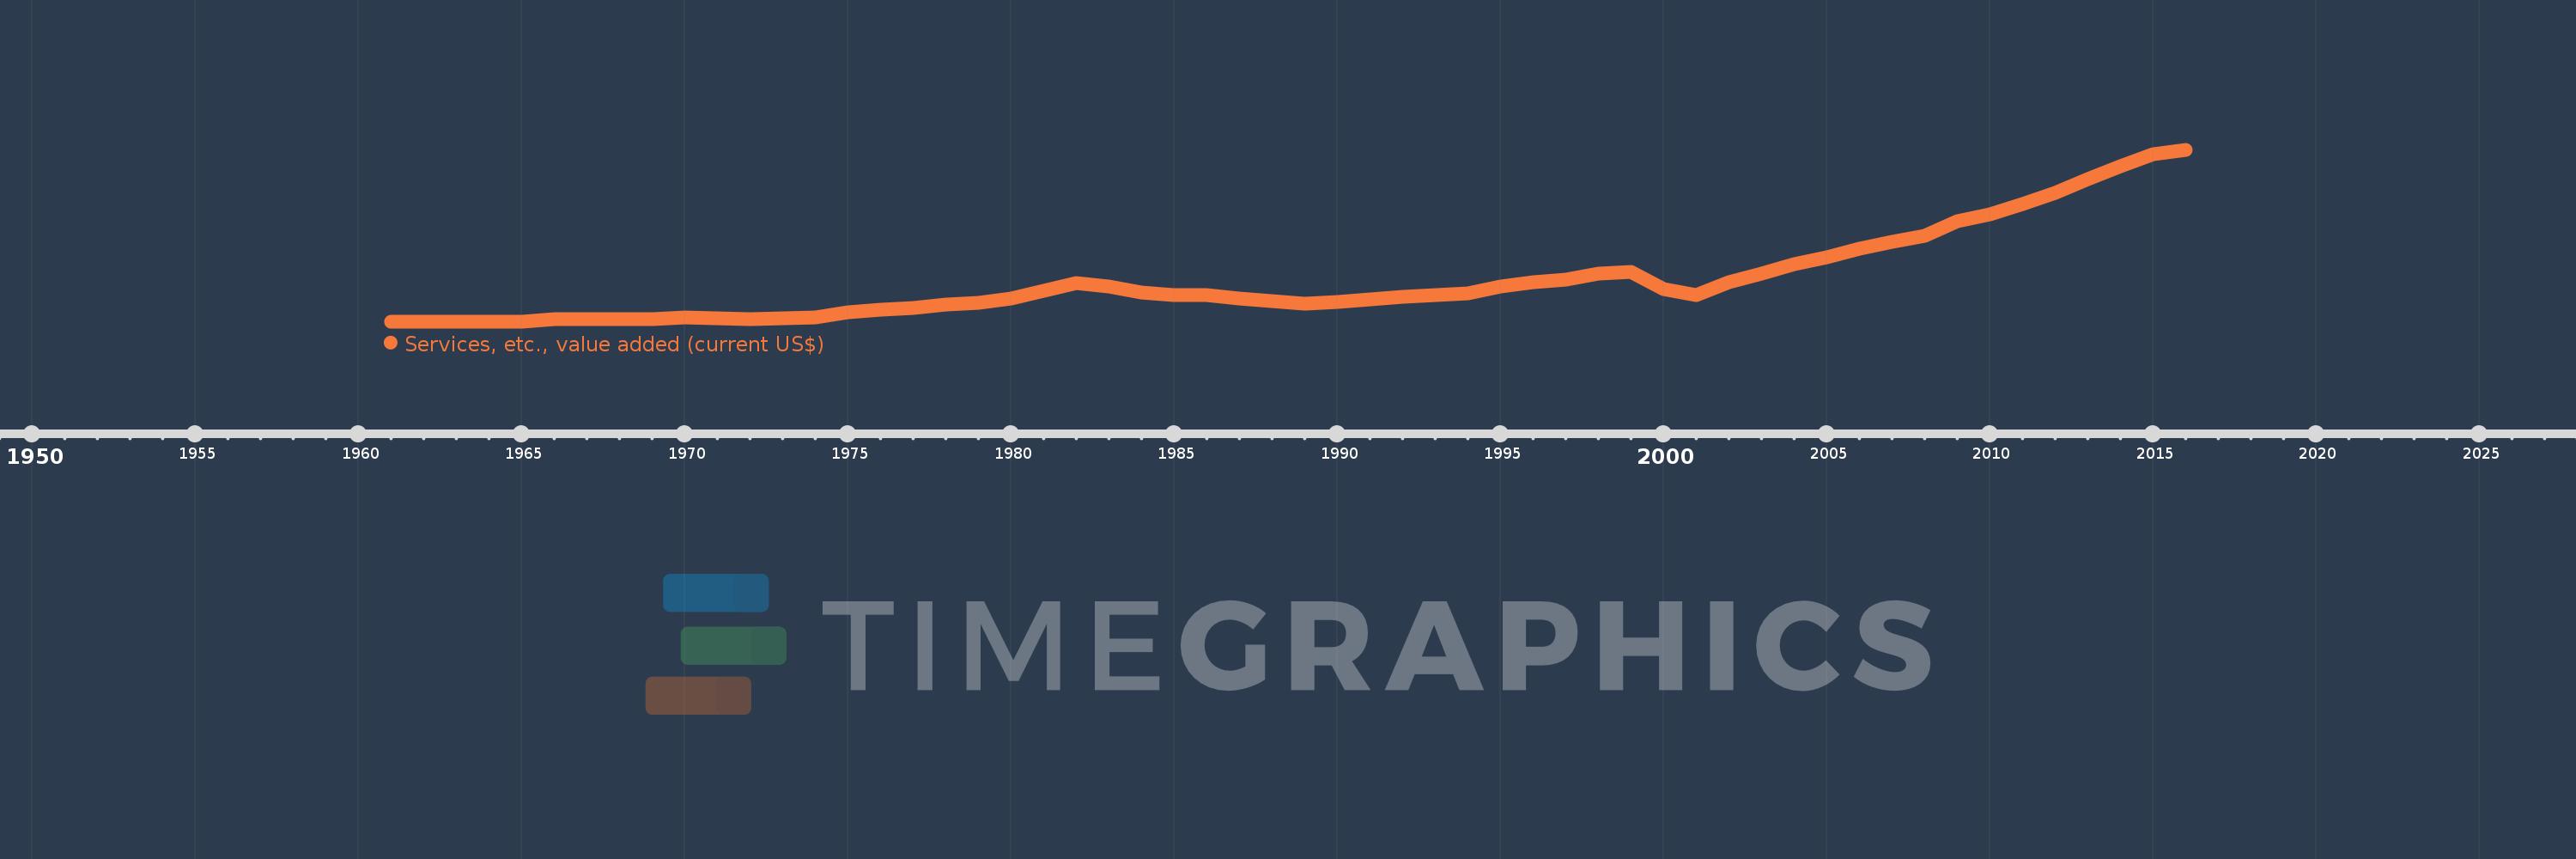
Services, etc., value added (current US$)
2016,2015,2014,2013,2012,2011,2010,2009,2008,2007,2006,2005,2004,2003,2002,2001,2000,1999,1998,1997,1996,1995,1994,1993,1992,1991,1990,1989,1988,1987,1986,1985,1984,1983,1982,1981,1980,1979,1978,1977,1976,1975,1974,1973,1972,1971,1970,1969,1968,1967,1966,1965,1964,1963,1962,1961
This statistics in other country:
AfghanistanAlbaniaAlgeriaAndorraAngolaAntigua and BarbudaArab WorldArgentinaArmeniaArubaAustraliaAustriaAzerbaijanBahamas, TheBahrainBangladeshBarbadosBelarusBelgiumBelizeBeninBermudaBhutanBoliviaBosnia and HerzegovinaBotswanaBrazilBrunei DarussalamBulgariaBurkina FasoBurundiCabo VerdeCambodiaCameroonCanadaCaribbean small statesCentral African RepublicCentral Europe and the BalticsChadChileChinaColombiaComorosCongo, Dem. Rep.Congo, Rep.Costa RicaCote d'IvoireCroatiaCubaCyprusCzech RepublicDenmarkDjiboutiDominicaDominican RepublicEarly-demographic dividendEast Asia & PacificEast Asia & Pacific (excluding high income)East Asia & Pacific (IDA & IBRD countries)EcuadorEgypt, Arab Rep.El SalvadorEquatorial GuineaEritreaEstoniaEthiopiaEuro areaEurope & Central AsiaEurope & Central Asia (excluding high income)Europe & Central Asia (IDA & IBRD countries)European UnionFaroe IslandsFijiFinlandFragile and conflict affected situationsFranceGabonGambia, TheGeorgiaGermanyGhanaGreeceGrenadaGuatemalaGuineaGuinea-BissauGuyanaHeavily indebted poor countries (HIPC)High incomeHondurasHong Kong SAR, ChinaHungaryIBRD onlyIcelandIDA & IBRD totalIDA blendIDA onlyIDA totalIndiaIndonesiaIran, Islamic Rep.IraqIrelandItalyJamaicaJapanJordanKazakhstanKenyaKiribatiKorea, Rep.KosovoKuwaitKyrgyz RepublicLao PDRLate-demographic dividendLatin America & Caribbean Latin America & Caribbean (excluding high income)Latin America & the Caribbean (IDA & IBRD countries)LatviaLeast developed countries: UN classificationLebanonLesothoLiberiaLibyaLithuaniaLow & middle incomeLow incomeLower middle incomeLuxembourgMacao SAR, ChinaMacedonia, FYRMadagascarMalawiMalaysiaMaldivesMaliMaltaMarshall IslandsMauritaniaMauritiusMexicoMicronesia, Fed. Sts.Middle East & North AfricaMiddle East & North Africa (excluding high income)Middle East & North Africa (IDA & IBRD countries)Middle incomeMoldovaMongoliaMontenegroMoroccoMozambiqueMyanmarNamibiaNepalNetherlandsNew CaledoniaNew ZealandNicaraguaNigerNigeriaNorth AmericaNorwayOECD membersOmanOther small statesPacific island small statesPakistanPalauPanamaPapua New GuineaParaguayPeruPhilippinesPolandPortugalPost-demographic dividendPre-demographic dividendPuerto RicoQatarRomaniaRussian FederationRwandaSamoaSao Tome and PrincipeSaudi ArabiaSenegalSerbiaSeychellesSierra LeoneSingaporeSlovak RepublicSloveniaSmall statesSolomon IslandsSouth AfricaSouth AsiaSouth Asia (IDA & IBRD)SpainSri LankaSt. Kitts and NevisSt. LuciaSt. Vincent and the GrenadinesSub-Saharan Africa Sub-Saharan Africa (excluding high income)Sub-Saharan Africa (IDA & IBRD countries)SudanSurinameSwazilandSwedenSwitzerlandSyrian Arab RepublicTajikistanTanzaniaThailandTimor-LesteTogoTongaTrinidad and TobagoTunisiaTurkeyTurkmenistanTuvaluUgandaUkraineUnited Arab EmiratesUnited KingdomUnited StatesUpper middle incomeUruguayUzbekistanVanuatuVenezuela, RBVietnamWest Bank and GazaWorldYemen, Rep.ZambiaZimbabwe Timeline:
This timeline shows a graph from 1961 to 2016 of Ecuador. No data until 1960. Number of actual observations by date: 56.
Source name:
World Development Indicators
Source organization:
World Bank national accounts data, and OECD National Accounts data files.
Categories, topics:
Economy & Growth
Last updated:
apr 23, 2017
Indicators value changes by year
Minimum:
376.969 mln
jan 1, 1963
Maximum:
51.76 bln
jan 1, 2016
At the date of observation
Value
Absolute change
Change from previous value
jan 1, 1961
404.867 mln
+404.867 mln
0.0%
jan 1, 1962
387.953 mln
-16.914 mln
-4.18%
jan 1, 1963
376.969 mln
-10.985 mln
-2.83%
jan 1, 1964
403.401 mln
+26.432 mln
7.01%
jan 1, 1965
450.584 mln
+47.183 mln
11.7%
jan 1, 1966
1.193 bln
+742.046 mln
164.69%
jan 1, 1967
1.258 bln
+65.176 mln
5.46%
jan 1, 1968
1.312 bln
+54.52 mln
4.33%
jan 1, 1969
1.265 bln
-47.434 mln
-3.61%
jan 1, 1970
1.615 bln
+350.455 mln
27.71%
jan 1, 1971
1.393 bln
-221.867 mln
-13.73%
jan 1, 1972
1.32 bln
-73.978 mln
-5.31%
jan 1, 1973
1.514 bln
+194.791 mln
14.76%
jan 1, 1974
1.858 bln
+343.918 mln
22.71%
jan 1, 1975
3.184 bln
+1.326 bln
71.36%
jan 1, 1976
3.947 bln
+763.066 mln
23.96%
jan 1, 1977
4.622 bln
+675.02 mln
17.1%
jan 1, 1978
5.657 bln
+1.035 bln
22.39%
jan 1, 1979
6.17 bln
+512.541 mln
9.06%
jan 1, 1980
7.505 bln
+1.336 bln
21.65%
jan 1, 1981
9.803 bln
+2.298 bln
30.61%
jan 1, 1982
12.09 bln
+2.287 bln
23.33%
jan 1, 1983
10.901 bln
-1.188 bln
-9.83%
jan 1, 1984
9.285 bln
-1.616 bln
-14.82%
jan 1, 1985
8.431 bln
-854.635 mln
-9.2%
jan 1, 1986
8.505 bln
+74.276 mln
0.88%
jan 1, 1987
7.432 bln
-1.073 bln
-12.61%
jan 1, 1988
6.742 bln
-690.434 mln
-9.29%
jan 1, 1989
5.903 bln
-838.678 mln
-12.44%
jan 1, 1990
6.339 bln
+435.302 mln
7.37%
jan 1, 1991
7.108 bln
+769.074 mln
12.13%
jan 1, 1992
7.841 bln
+733.456 mln
10.32%
jan 1, 1993
8.52 bln
+678.793 mln
8.66%
jan 1, 1994
8.808 bln
+287.909 mln
3.38%
jan 1, 1995
11.084 bln
+2.276 bln
25.84%
jan 1, 1996
12.288 bln
+1.205 bln
10.87%
jan 1, 1997
13.07 bln
+781.315 mln
6.36%
jan 1, 1998
14.815 bln
+1.745 bln
13.35%
jan 1, 1999
15.293 bln
+478.066 mln
3.23%
jan 1, 2000
10.292 bln
-5.001 bln
-32.7%
jan 1, 2001
8.297 bln
-1.996 bln
-19.39%
jan 1, 2002
12.327 bln
+4.031 bln
48.58%
jan 1, 2003
14.809 bln
+2.482 bln
20.13%
jan 1, 2004
17.573 bln
+2.764 bln
18.67%
jan 1, 2005
19.78 bln
+2.206 bln
12.55%
jan 1, 2006
22.177 bln
+2.397 bln
12.12%
jan 1, 2007
24.234 bln
+2.058 bln
9.28%
jan 1, 2008
26.162 bln
+1.928 bln
7.96%
jan 1, 2009
30.593 bln
+4.431 bln
16.94%
jan 1, 2010
32.548 bln
+1.954 bln
6.39%
jan 1, 2011
35.577 bln
+3.029 bln
9.31%
jan 1, 2012
39.089 bln
+3.512 bln
9.87%
jan 1, 2013
43.061 bln
+3.972 bln
10.16%
jan 1, 2014
46.855 bln
+3.793 bln
8.81%
jan 1, 2015
50.523 bln
+3.668 bln
7.83%
jan 1, 2016
51.76 bln
+1.238 bln
2.45%
Ranking of countries by current statistics by years


Comments: