29
/
en
AIzaSyAYiBZKx7MnpbEhh9jyipgxe19OcubqV5w
April 1, 2024
250310
St. Kitts and Nevis
KNA
true
2
1
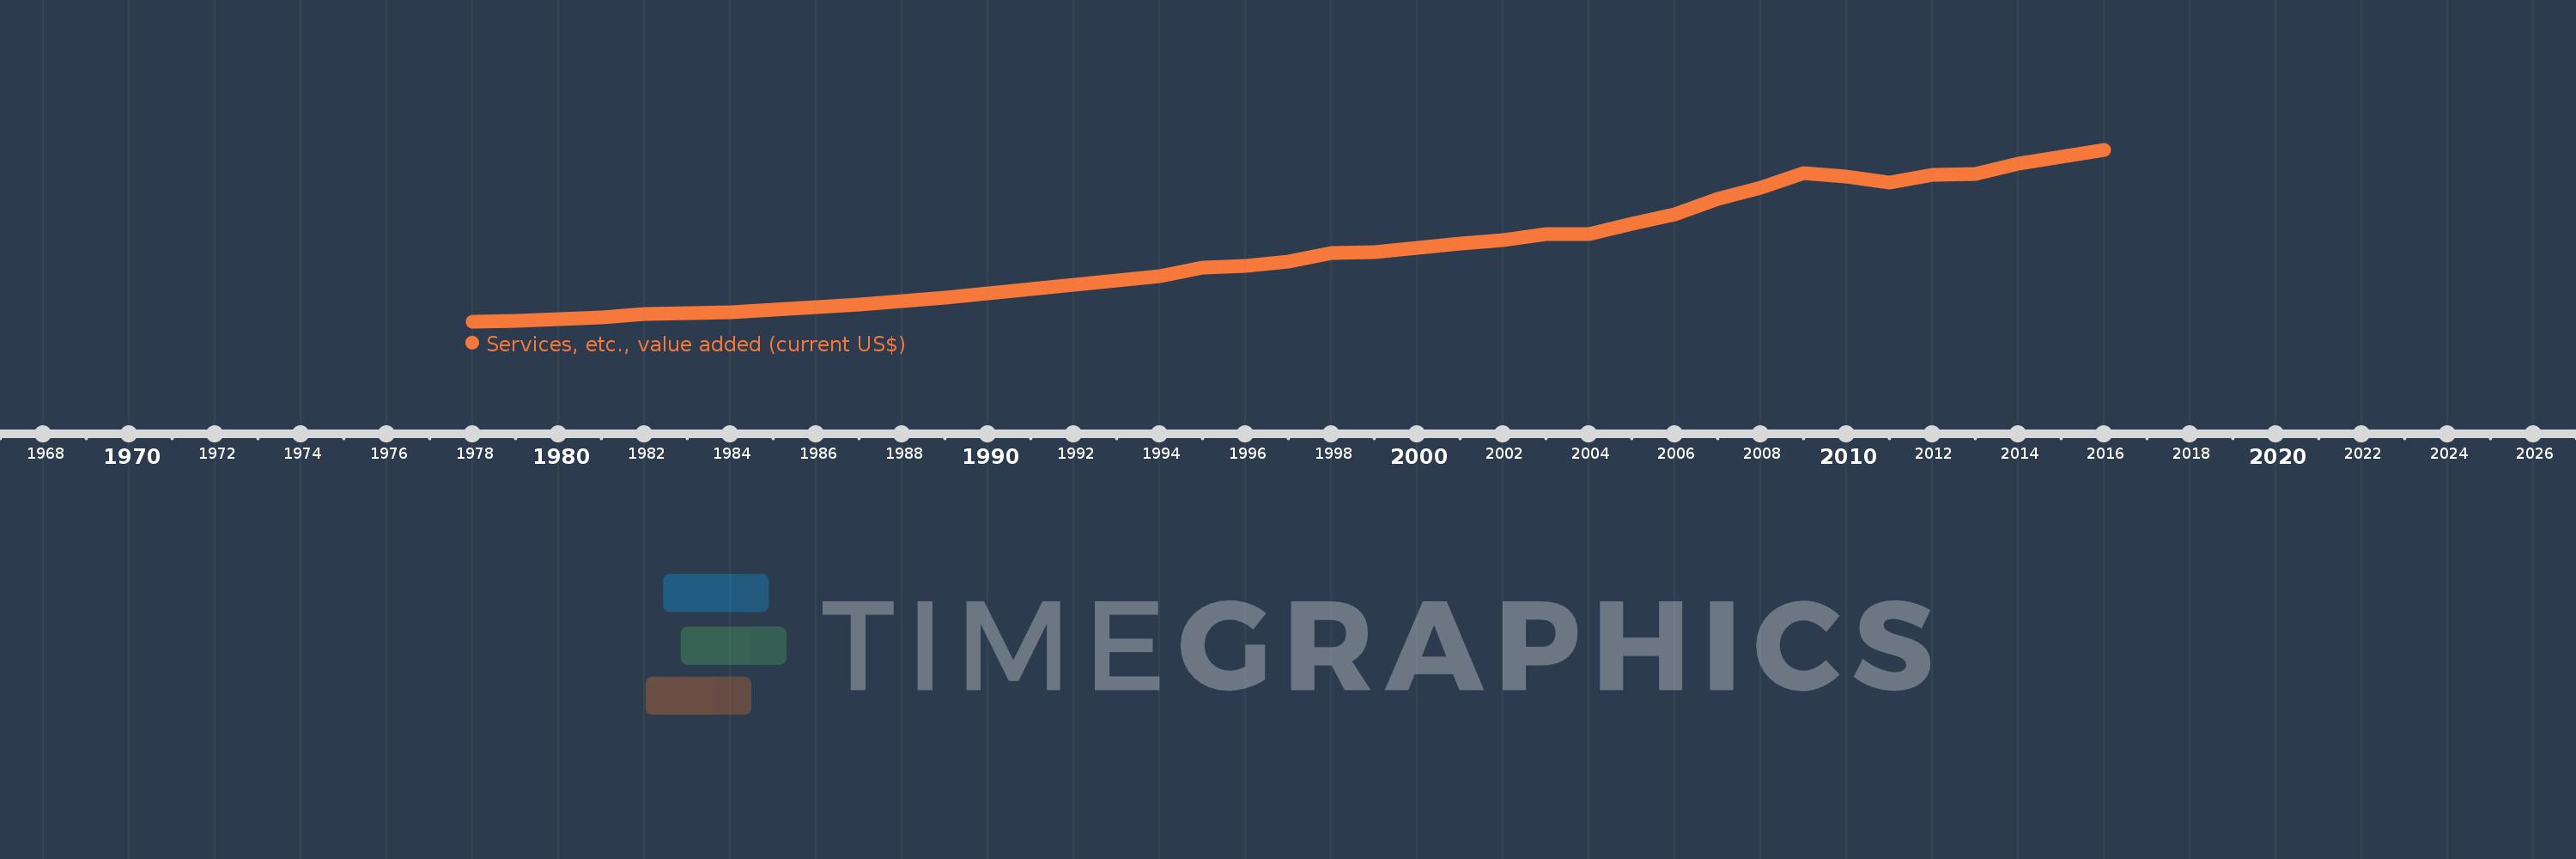
Services, etc., value added (current US$)
2016,2015,2014,2013,2012,2011,2010,2009,2008,2007,2006,2005,2004,2003,2002,2001,2000,1999,1998,1997,1996,1995,1994,1993,1992,1991,1990,1989,1988,1987,1986,1985,1984,1983,1982,1981,1980,1979,1978
This statistics in other country:
AfghanistanAlbaniaAlgeriaAndorraAngolaAntigua and BarbudaArab WorldArgentinaArmeniaArubaAustraliaAustriaAzerbaijanBahamas, TheBahrainBangladeshBarbadosBelarusBelgiumBelizeBeninBermudaBhutanBoliviaBosnia and HerzegovinaBotswanaBrazilBrunei DarussalamBulgariaBurkina FasoBurundiCabo VerdeCambodiaCameroonCanadaCaribbean small statesCentral African RepublicCentral Europe and the BalticsChadChileChinaColombiaComorosCongo, Dem. Rep.Congo, Rep.Costa RicaCote d'IvoireCroatiaCubaCyprusCzech RepublicDenmarkDjiboutiDominicaDominican RepublicEarly-demographic dividendEast Asia & PacificEast Asia & Pacific (excluding high income)East Asia & Pacific (IDA & IBRD countries)EcuadorEgypt, Arab Rep.El SalvadorEquatorial GuineaEritreaEstoniaEthiopiaEuro areaEurope & Central AsiaEurope & Central Asia (excluding high income)Europe & Central Asia (IDA & IBRD countries)European UnionFaroe IslandsFijiFinlandFragile and conflict affected situationsFranceGabonGambia, TheGeorgiaGermanyGhanaGreeceGrenadaGuatemalaGuineaGuinea-BissauGuyanaHeavily indebted poor countries (HIPC)High incomeHondurasHong Kong SAR, ChinaHungaryIBRD onlyIcelandIDA & IBRD totalIDA blendIDA onlyIDA totalIndiaIndonesiaIran, Islamic Rep.IraqIrelandItalyJamaicaJapanJordanKazakhstanKenyaKiribatiKorea, Rep.KosovoKuwaitKyrgyz RepublicLao PDRLate-demographic dividendLatin America & Caribbean Latin America & Caribbean (excluding high income)Latin America & the Caribbean (IDA & IBRD countries)LatviaLeast developed countries: UN classificationLebanonLesothoLiberiaLibyaLithuaniaLow & middle incomeLow incomeLower middle incomeLuxembourgMacao SAR, ChinaMacedonia, FYRMadagascarMalawiMalaysiaMaldivesMaliMaltaMarshall IslandsMauritaniaMauritiusMexicoMicronesia, Fed. Sts.Middle East & North AfricaMiddle East & North Africa (excluding high income)Middle East & North Africa (IDA & IBRD countries)Middle incomeMoldovaMongoliaMontenegroMoroccoMozambiqueMyanmarNamibiaNepalNetherlandsNew CaledoniaNew ZealandNicaraguaNigerNigeriaNorth AmericaNorwayOECD membersOmanOther small statesPacific island small statesPakistanPalauPanamaPapua New GuineaParaguayPeruPhilippinesPolandPortugalPost-demographic dividendPre-demographic dividendPuerto RicoQatarRomaniaRussian FederationRwandaSamoaSao Tome and PrincipeSaudi ArabiaSenegalSerbiaSeychellesSierra LeoneSingaporeSlovak RepublicSloveniaSmall statesSolomon IslandsSouth AfricaSouth AsiaSouth Asia (IDA & IBRD)SpainSri LankaSt. Kitts and NevisSt. LuciaSt. Vincent and the GrenadinesSub-Saharan Africa Sub-Saharan Africa (excluding high income)Sub-Saharan Africa (IDA & IBRD countries)SudanSurinameSwazilandSwedenSwitzerlandSyrian Arab RepublicTajikistanTanzaniaThailandTimor-LesteTogoTongaTrinidad and TobagoTunisiaTurkeyTurkmenistanTuvaluUgandaUkraineUnited Arab EmiratesUnited KingdomUnited StatesUpper middle incomeUruguayUzbekistanVanuatuVenezuela, RBVietnamWest Bank and GazaWorldYemen, Rep.ZambiaZimbabwe Timeline:
This timeline shows a graph from 1978 to 2016 of St. Kitts and Nevis. No data until 1977. Number of actual observations by date: 39.
Source name:
World Development Indicators
Source organization:
World Bank national accounts data, and OECD National Accounts data files.
Categories, topics:
Economy & Growth
Last updated:
apr 23, 2017
Indicators value changes by year
Minimum:
26.664 mln
jan 1, 1978
Maximum:
527.392 mln
jan 1, 2016
At the date of observation
Value
Absolute change
Change from previous value
jan 1, 1978
26.664 mln
+26.664 mln
0.0%
jan 1, 1979
30.225 mln
+3.562 mln
13.36%
jan 1, 1980
35.968 mln
+5.743 mln
19.0%
jan 1, 1981
39.32 mln
+3.352 mln
9.32%
jan 1, 1982
49.674 mln
+10.354 mln
26.33%
jan 1, 1983
53.686 mln
+4.012 mln
8.08%
jan 1, 1984
54.936 mln
+1.249 mln
2.33%
jan 1, 1985
62.312 mln
+7.377 mln
13.43%
jan 1, 1986
71.213 mln
+8.901 mln
14.28%
jan 1, 1987
78.597 mln
+7.384 mln
10.37%
jan 1, 1988
86.263 mln
+7.666 mln
9.75%
jan 1, 1989
97.085 mln
+10.822 mln
12.55%
jan 1, 1990
109.711 mln
+12.627 mln
13.01%
jan 1, 1991
123.303 mln
+13.592 mln
12.39%
jan 1, 1992
134.286 mln
+10.983 mln
8.91%
jan 1, 1993
146.534 mln
+12.248 mln
9.12%
jan 1, 1994
159.991 mln
+13.457 mln
9.18%
jan 1, 1995
184.773 mln
+24.781 mln
15.49%
jan 1, 1996
190.344 mln
+5.572 mln
3.02%
jan 1, 1997
202.836 mln
+12.492 mln
6.56%
jan 1, 1998
228.947 mln
+26.111 mln
12.87%
jan 1, 1999
231.379 mln
+2.431 mln
1.06%
jan 1, 2000
243.67 mln
+12.291 mln
5.31%
jan 1, 2001
256.39 mln
+12.72 mln
5.22%
jan 1, 2002
265.293 mln
+8.904 mln
3.47%
jan 1, 2003
282.609 mln
+17.315 mln
6.53%
jan 1, 2004
282.782 mln
+172.914K
0.06%
jan 1, 2005
311.666 mln
+28.884 mln
10.21%
jan 1, 2006
339.152 mln
+27.487 mln
8.82%
jan 1, 2007
386.649 mln
+47.497 mln
14.0%
jan 1, 2008
417.621 mln
+30.972 mln
8.01%
jan 1, 2009
459.652 mln
+42.031 mln
10.06%
jan 1, 2010
450.871 mln
-8.781 mln
-1.91%
jan 1, 2011
433.935 mln
-16.936 mln
-3.76%
jan 1, 2012
454.387 mln
+20.452 mln
4.71%
jan 1, 2013
459.015 mln
+4.629 mln
1.02%
jan 1, 2014
488.503 mln
+29.487 mln
6.42%
jan 1, 2015
509.103 mln
+20.6 mln
4.22%
jan 1, 2016
527.392 mln
+18.29 mln
3.59%
Ranking of countries by current statistics by years


Comments: