29
/
en
AIzaSyAYiBZKx7MnpbEhh9jyipgxe19OcubqV5w
April 1, 2024
137390
Gambia, The
GMB
true
2
1
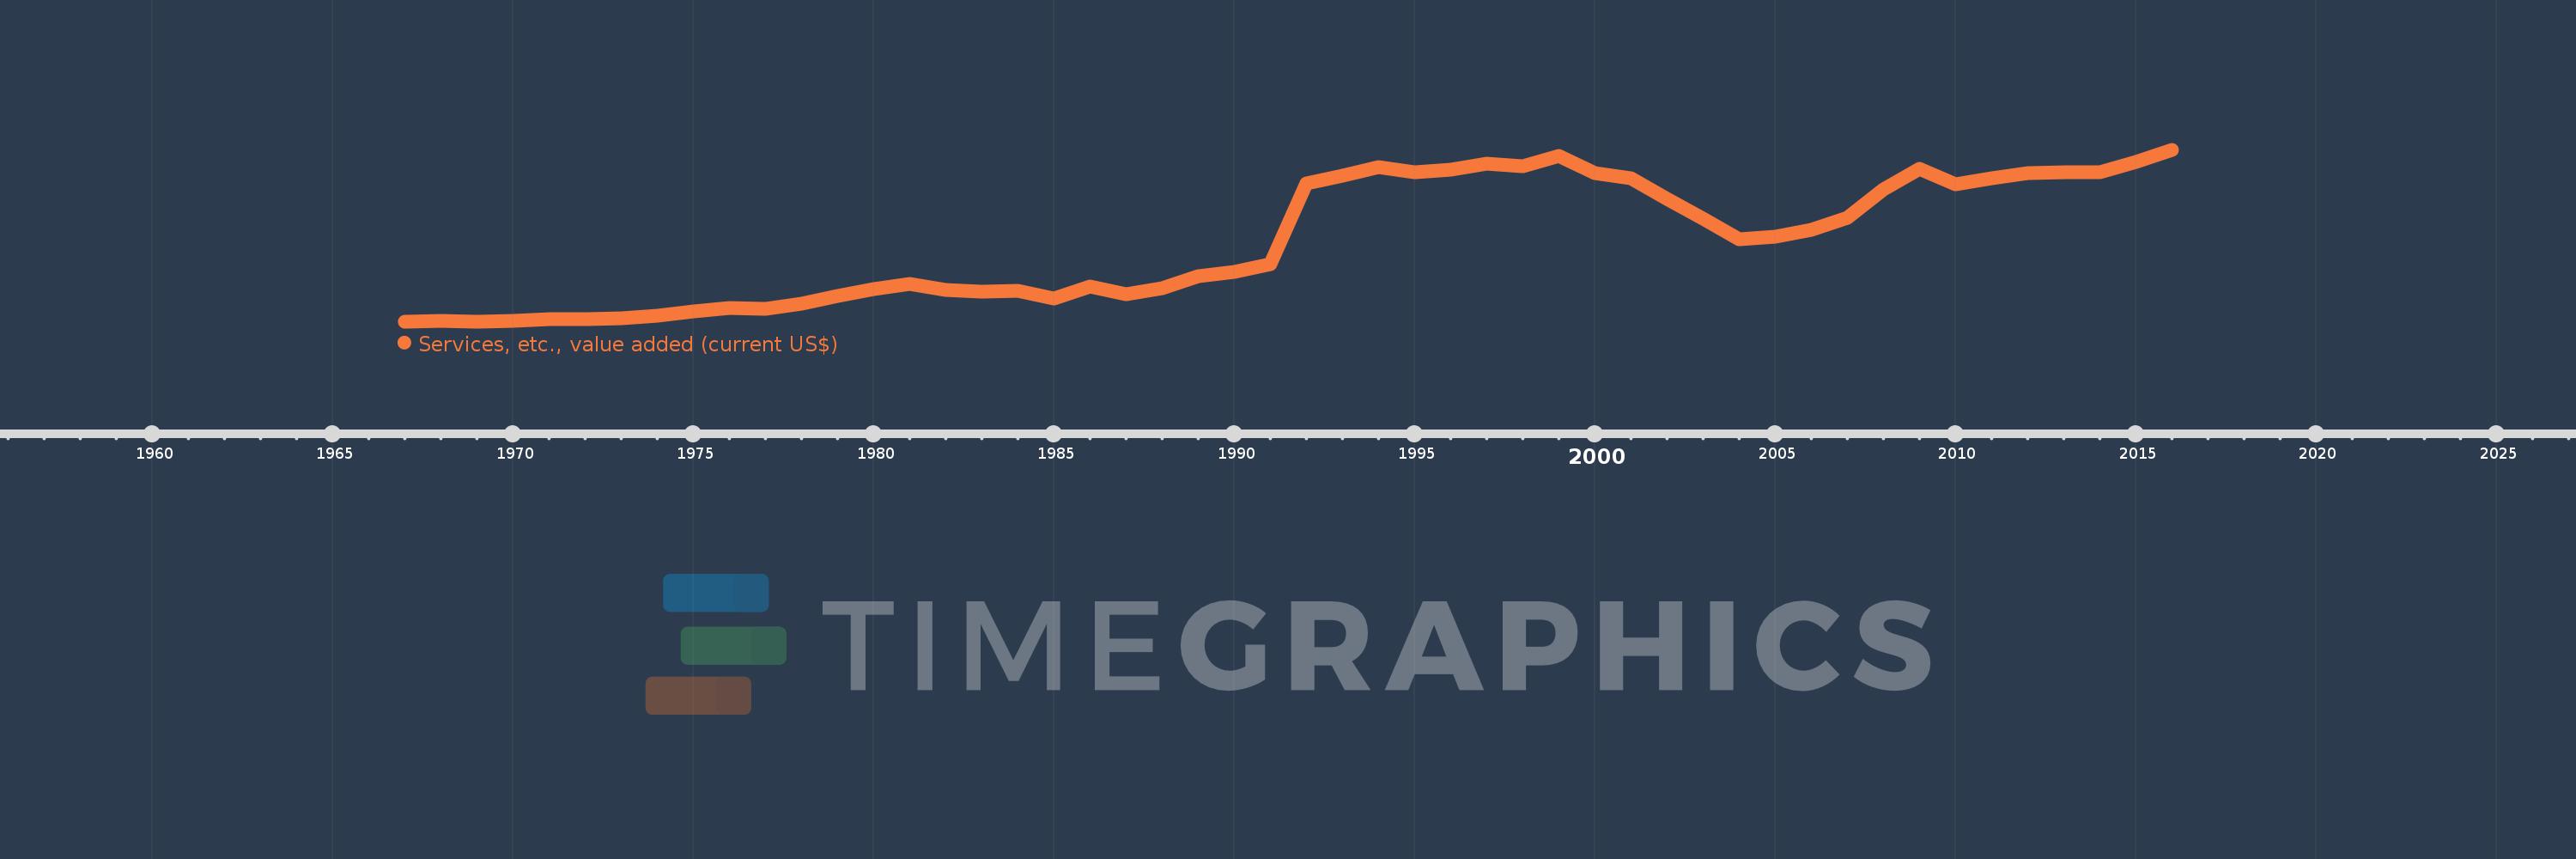
Services, etc., value added (current US$)
2016,2015,2014,2013,2012,2011,2010,2009,2008,2007,2006,2005,2004,2003,2002,2001,2000,1999,1998,1997,1996,1995,1994,1993,1992,1991,1990,1989,1988,1987,1986,1985,1984,1983,1982,1981,1980,1979,1978,1977,1976,1975,1974,1973,1972,1971,1970,1969,1968,1967
This statistics in other country:
AfghanistanAlbaniaAlgeriaAndorraAngolaAntigua and BarbudaArab WorldArgentinaArmeniaArubaAustraliaAustriaAzerbaijanBahamas, TheBahrainBangladeshBarbadosBelarusBelgiumBelizeBeninBermudaBhutanBoliviaBosnia and HerzegovinaBotswanaBrazilBrunei DarussalamBulgariaBurkina FasoBurundiCabo VerdeCambodiaCameroonCanadaCaribbean small statesCentral African RepublicCentral Europe and the BalticsChadChileChinaColombiaComorosCongo, Dem. Rep.Congo, Rep.Costa RicaCote d'IvoireCroatiaCubaCyprusCzech RepublicDenmarkDjiboutiDominicaDominican RepublicEarly-demographic dividendEast Asia & PacificEast Asia & Pacific (excluding high income)East Asia & Pacific (IDA & IBRD countries)EcuadorEgypt, Arab Rep.El SalvadorEquatorial GuineaEritreaEstoniaEthiopiaEuro areaEurope & Central AsiaEurope & Central Asia (excluding high income)Europe & Central Asia (IDA & IBRD countries)European UnionFaroe IslandsFijiFinlandFragile and conflict affected situationsFranceGabonGambia, TheGeorgiaGermanyGhanaGreeceGrenadaGuatemalaGuineaGuinea-BissauGuyanaHeavily indebted poor countries (HIPC)High incomeHondurasHong Kong SAR, ChinaHungaryIBRD onlyIcelandIDA & IBRD totalIDA blendIDA onlyIDA totalIndiaIndonesiaIran, Islamic Rep.IraqIrelandItalyJamaicaJapanJordanKazakhstanKenyaKiribatiKorea, Rep.KosovoKuwaitKyrgyz RepublicLao PDRLate-demographic dividendLatin America & Caribbean Latin America & Caribbean (excluding high income)Latin America & the Caribbean (IDA & IBRD countries)LatviaLeast developed countries: UN classificationLebanonLesothoLiberiaLibyaLithuaniaLow & middle incomeLow incomeLower middle incomeLuxembourgMacao SAR, ChinaMacedonia, FYRMadagascarMalawiMalaysiaMaldivesMaliMaltaMarshall IslandsMauritaniaMauritiusMexicoMicronesia, Fed. Sts.Middle East & North AfricaMiddle East & North Africa (excluding high income)Middle East & North Africa (IDA & IBRD countries)Middle incomeMoldovaMongoliaMontenegroMoroccoMozambiqueMyanmarNamibiaNepalNetherlandsNew CaledoniaNew ZealandNicaraguaNigerNigeriaNorth AmericaNorwayOECD membersOmanOther small statesPacific island small statesPakistanPalauPanamaPapua New GuineaParaguayPeruPhilippinesPolandPortugalPost-demographic dividendPre-demographic dividendPuerto RicoQatarRomaniaRussian FederationRwandaSamoaSao Tome and PrincipeSaudi ArabiaSenegalSerbiaSeychellesSierra LeoneSingaporeSlovak RepublicSloveniaSmall statesSolomon IslandsSouth AfricaSouth AsiaSouth Asia (IDA & IBRD)SpainSri LankaSt. Kitts and NevisSt. LuciaSt. Vincent and the GrenadinesSub-Saharan Africa Sub-Saharan Africa (excluding high income)Sub-Saharan Africa (IDA & IBRD countries)SudanSurinameSwazilandSwedenSwitzerlandSyrian Arab RepublicTajikistanTanzaniaThailandTimor-LesteTogoTongaTrinidad and TobagoTunisiaTurkeyTurkmenistanTuvaluUgandaUkraineUnited Arab EmiratesUnited KingdomUnited StatesUpper middle incomeUruguayUzbekistanVanuatuVenezuela, RBVietnamWest Bank and GazaWorldYemen, Rep.ZambiaZimbabwe Timeline:
This timeline shows a graph from 1967 to 2016 of Gambia, The. No data until 1966. Number of actual observations by date: 50.
Source name:
World Development Indicators
Source organization:
World Bank national accounts data, and OECD National Accounts data files.
Categories, topics:
Economy & Growth
Last updated:
apr 23, 2017
Indicators value changes by year
Minimum:
24.456 mln
jan 1, 1969
Maximum:
562.651 mln
jan 1, 2016
At the date of observation
Value
Absolute change
Change from previous value
jan 1, 1967
26.292 mln
+26.292 mln
0.0%
jan 1, 1968
27.734 mln
+1.442 mln
5.48%
jan 1, 1969
24.456 mln
-3.277 mln
-11.82%
jan 1, 1970
26.856 mln
+2.4 mln
9.81%
jan 1, 1971
32.185 mln
+5.328 mln
19.84%
jan 1, 1972
34.24 mln
+2.056 mln
6.39%
jan 1, 1973
35.177 mln
+936.893K
2.74%
jan 1, 1974
44.76 mln
+9.583 mln
27.24%
jan 1, 1975
56.988 mln
+12.227 mln
27.32%
jan 1, 1976
68.003 mln
+11.016 mln
19.33%
jan 1, 1977
64.789 mln
-3.215 mln
-4.73%
jan 1, 1978
82.098 mln
+17.309 mln
26.72%
jan 1, 1979
105.528 mln
+23.43 mln
28.54%
jan 1, 1980
127.709 mln
+22.18 mln
21.02%
jan 1, 1981
144.567 mln
+16.859 mln
13.2%
jan 1, 1982
124.452 mln
-20.115 mln
-13.91%
jan 1, 1983
118.825 mln
-5.627 mln
-4.52%
jan 1, 1984
121.22 mln
+2.395 mln
2.02%
jan 1, 1985
98.156 mln
-23.064 mln
-19.03%
jan 1, 1986
135.378 mln
+37.223 mln
37.92%
jan 1, 1987
111.148 mln
-24.23 mln
-17.9%
jan 1, 1988
129.29 mln
+18.142 mln
16.32%
jan 1, 1989
168.289 mln
+38.999 mln
30.16%
jan 1, 1990
181.075 mln
+12.786 mln
7.6%
jan 1, 1991
204.988 mln
+23.913 mln
13.21%
jan 1, 1992
458.929 mln
+253.941 mln
123.88%
jan 1, 1993
482.153 mln
+23.224 mln
5.06%
jan 1, 1994
510.359 mln
+28.206 mln
5.85%
jan 1, 1995
493.758 mln
-16.602 mln
-3.25%
jan 1, 1996
501.209 mln
+7.452 mln
1.51%
jan 1, 1997
520.397 mln
+19.188 mln
3.83%
jan 1, 1998
513.081 mln
-7.317 mln
-1.41%
jan 1, 1999
543.898 mln
+30.817 mln
6.01%
jan 1, 2000
492.04 mln
-51.857 mln
-9.53%
jan 1, 2001
474.799 mln
-17.241 mln
-3.5%
jan 1, 2002
411.122 mln
-63.677 mln
-13.41%
jan 1, 2003
347.335 mln
-63.787 mln
-15.52%
jan 1, 2004
284.444 mln
-62.892 mln
-18.11%
jan 1, 2005
290.744 mln
+6.3 mln
2.21%
jan 1, 2006
312.498 mln
+21.754 mln
7.48%
jan 1, 2007
350.867 mln
+38.37 mln
12.28%
jan 1, 2008
439.435 mln
+88.567 mln
25.24%
jan 1, 2009
502.944 mln
+63.509 mln
14.45%
jan 1, 2010
456.806 mln
-46.138 mln
-9.17%
jan 1, 2011
475.65 mln
+18.845 mln
4.13%
jan 1, 2012
491.891 mln
+16.241 mln
3.41%
jan 1, 2013
494.544 mln
+2.653 mln
0.54%
jan 1, 2014
494.785 mln
+240.87K
0.05%
jan 1, 2015
525.876 mln
+31.092 mln
6.28%
jan 1, 2016
562.651 mln
+36.775 mln
6.99%
Ranking of countries by current statistics by years


Comments: