29
/
en
AIzaSyAYiBZKx7MnpbEhh9jyipgxe19OcubqV5w
April 1, 2024
205841
Namibia
NAM
true
2
1
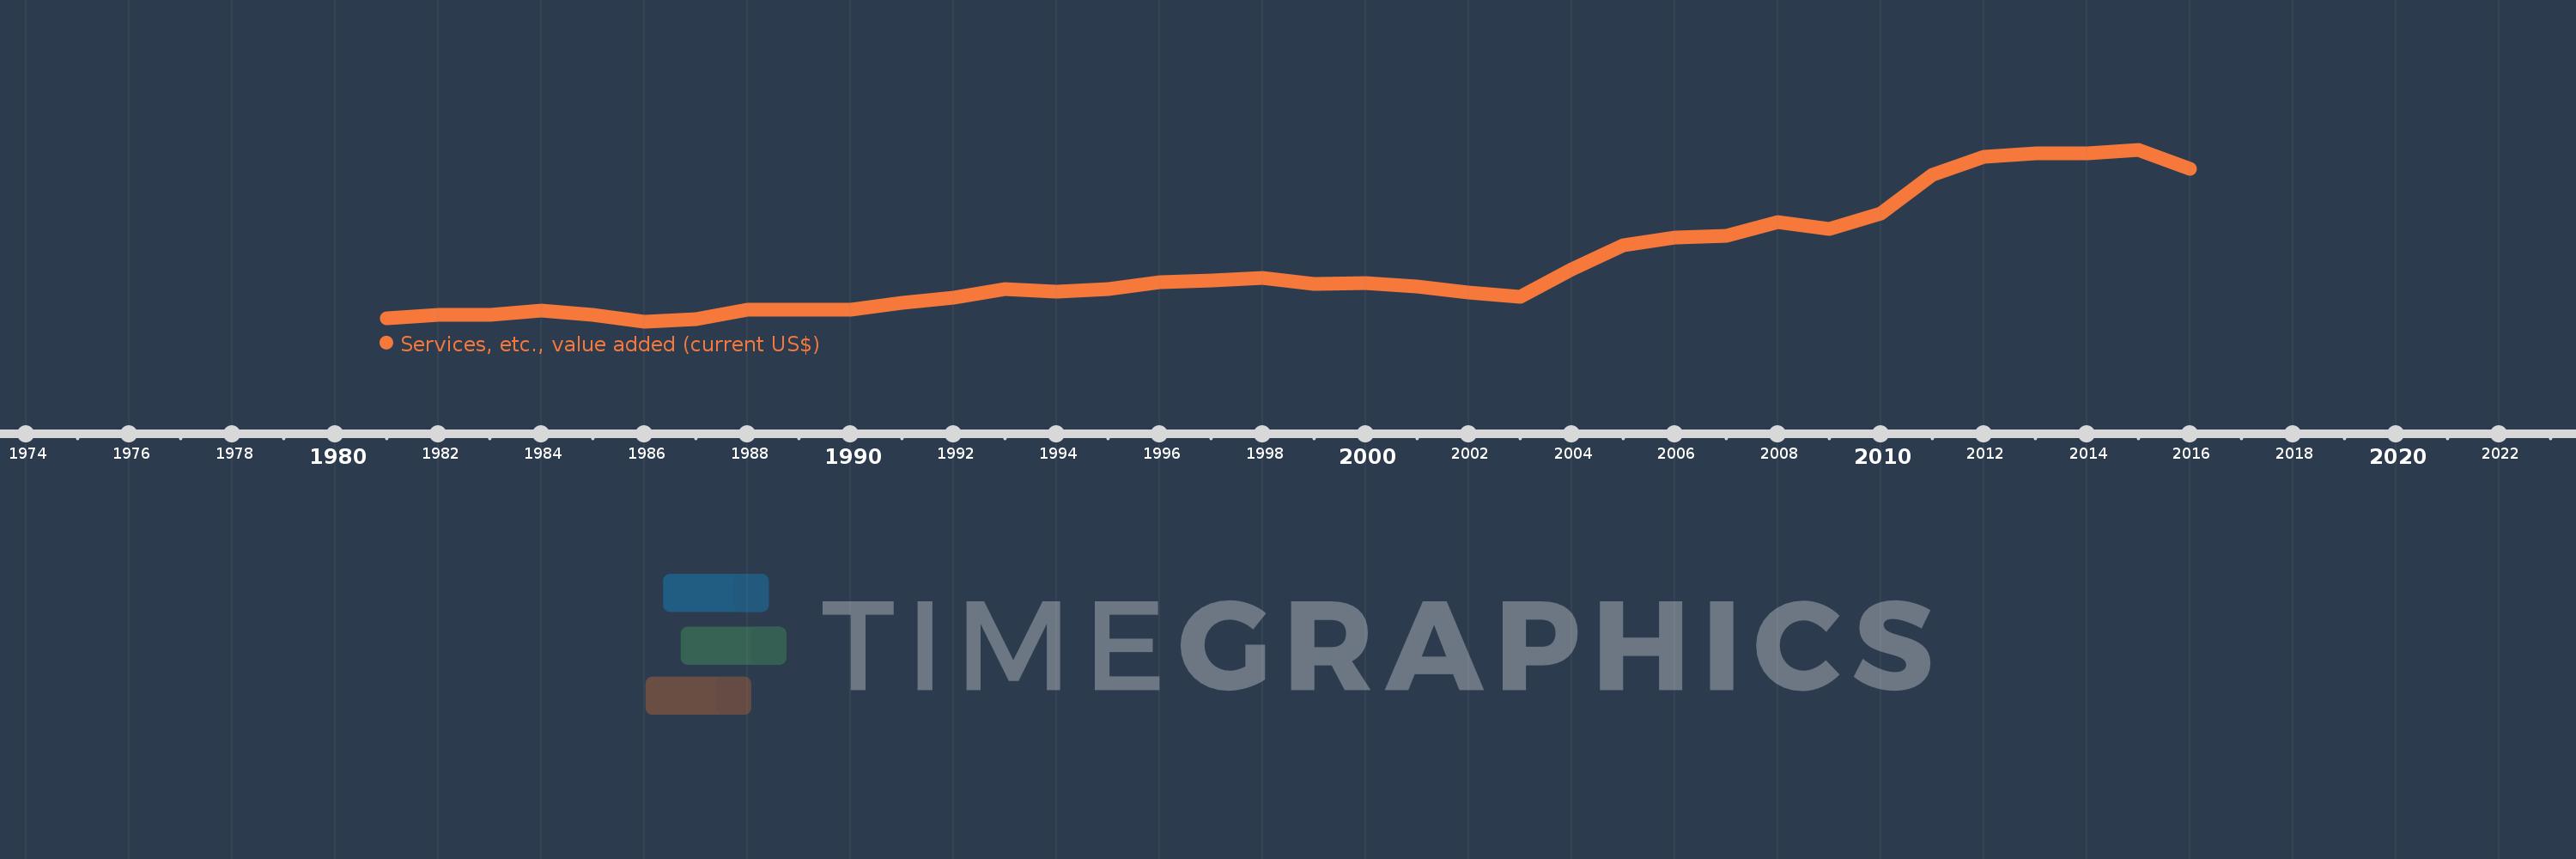
Services, etc., value added (current US$)
2016,2015,2014,2013,2012,2011,2010,2009,2008,2007,2006,2005,2004,2003,2002,2001,2000,1999,1998,1997,1996,1995,1994,1993,1992,1991,1990,1989,1988,1987,1986,1985,1984,1983,1982,1981
This statistics in other country:
AfghanistanAlbaniaAlgeriaAndorraAngolaAntigua and BarbudaArab WorldArgentinaArmeniaArubaAustraliaAustriaAzerbaijanBahamas, TheBahrainBangladeshBarbadosBelarusBelgiumBelizeBeninBermudaBhutanBoliviaBosnia and HerzegovinaBotswanaBrazilBrunei DarussalamBulgariaBurkina FasoBurundiCabo VerdeCambodiaCameroonCanadaCaribbean small statesCentral African RepublicCentral Europe and the BalticsChadChileChinaColombiaComorosCongo, Dem. Rep.Congo, Rep.Costa RicaCote d'IvoireCroatiaCubaCyprusCzech RepublicDenmarkDjiboutiDominicaDominican RepublicEarly-demographic dividendEast Asia & PacificEast Asia & Pacific (excluding high income)East Asia & Pacific (IDA & IBRD countries)EcuadorEgypt, Arab Rep.El SalvadorEquatorial GuineaEritreaEstoniaEthiopiaEuro areaEurope & Central AsiaEurope & Central Asia (excluding high income)Europe & Central Asia (IDA & IBRD countries)European UnionFaroe IslandsFijiFinlandFragile and conflict affected situationsFranceGabonGambia, TheGeorgiaGermanyGhanaGreeceGrenadaGuatemalaGuineaGuinea-BissauGuyanaHeavily indebted poor countries (HIPC)High incomeHondurasHong Kong SAR, ChinaHungaryIBRD onlyIcelandIDA & IBRD totalIDA blendIDA onlyIDA totalIndiaIndonesiaIran, Islamic Rep.IraqIrelandItalyJamaicaJapanJordanKazakhstanKenyaKiribatiKorea, Rep.KosovoKuwaitKyrgyz RepublicLao PDRLate-demographic dividendLatin America & Caribbean Latin America & Caribbean (excluding high income)Latin America & the Caribbean (IDA & IBRD countries)LatviaLeast developed countries: UN classificationLebanonLesothoLiberiaLibyaLithuaniaLow & middle incomeLow incomeLower middle incomeLuxembourgMacao SAR, ChinaMacedonia, FYRMadagascarMalawiMalaysiaMaldivesMaliMaltaMarshall IslandsMauritaniaMauritiusMexicoMicronesia, Fed. Sts.Middle East & North AfricaMiddle East & North Africa (excluding high income)Middle East & North Africa (IDA & IBRD countries)Middle incomeMoldovaMongoliaMontenegroMoroccoMozambiqueMyanmarNamibiaNepalNetherlandsNew CaledoniaNew ZealandNicaraguaNigerNigeriaNorth AmericaNorwayOECD membersOmanOther small statesPacific island small statesPakistanPalauPanamaPapua New GuineaParaguayPeruPhilippinesPolandPortugalPost-demographic dividendPre-demographic dividendPuerto RicoQatarRomaniaRussian FederationRwandaSamoaSao Tome and PrincipeSaudi ArabiaSenegalSerbiaSeychellesSierra LeoneSingaporeSlovak RepublicSloveniaSmall statesSolomon IslandsSouth AfricaSouth AsiaSouth Asia (IDA & IBRD)SpainSri LankaSt. Kitts and NevisSt. LuciaSt. Vincent and the GrenadinesSub-Saharan Africa Sub-Saharan Africa (excluding high income)Sub-Saharan Africa (IDA & IBRD countries)SudanSurinameSwazilandSwedenSwitzerlandSyrian Arab RepublicTajikistanTanzaniaThailandTimor-LesteTogoTongaTrinidad and TobagoTunisiaTurkeyTurkmenistanTuvaluUgandaUkraineUnited Arab EmiratesUnited KingdomUnited StatesUpper middle incomeUruguayUzbekistanVanuatuVenezuela, RBVietnamWest Bank and GazaWorldYemen, Rep.ZambiaZimbabwe Timeline:
This timeline shows a graph from 1981 to 2016 of Namibia. No data until 1980. Number of actual observations by date: 36.
Source name:
World Development Indicators
Source organization:
World Bank national accounts data, and OECD National Accounts data files.
Categories, topics:
Economy & Growth
Last updated:
apr 23, 2017
Indicators value changes by year
Minimum:
803.721 mln
jan 1, 1986
Maximum:
7.248 bln
jan 1, 2015
At the date of observation
Value
Absolute change
Change from previous value
jan 1, 1981
941.105 mln
+941.105 mln
0.0%
jan 1, 1982
1.064 bln
+122.917 mln
13.06%
jan 1, 1983
1.078 bln
+13.544 mln
1.27%
jan 1, 1984
1.222 bln
+144.665 mln
13.43%
jan 1, 1985
1.073 bln
-149.099 mln
-12.2%
jan 1, 1986
803.721 mln
-269.411 mln
-25.11%
jan 1, 1987
916.293 mln
+112.573 mln
14.01%
jan 1, 1988
1.258 bln
+341.222 mln
37.24%
jan 1, 1989
1.27 bln
+12.697 mln
1.01%
jan 1, 1990
1.278 bln
+7.802 mln
0.61%
jan 1, 1991
1.515 bln
+236.774 mln
18.53%
jan 1, 1992
1.701 bln
+186.594 mln
12.32%
jan 1, 1993
2.039 bln
+337.142 mln
19.82%
jan 1, 1994
1.939 bln
-99.161 mln
-4.86%
jan 1, 1995
2.036 bln
+97.0 mln
5.0%
jan 1, 1996
2.3 bln
+263.503 mln
12.94%
jan 1, 1997
2.354 bln
+54.213 mln
2.36%
jan 1, 1998
2.453 bln
+98.498 mln
4.18%
jan 1, 1999
2.247 bln
-205.542 mln
-8.38%
jan 1, 2000
2.252 bln
+5.254 mln
0.23%
jan 1, 2001
2.144 bln
-108.692 mln
-4.83%
jan 1, 2002
1.917 bln
-226.419 mln
-10.56%
jan 1, 2003
1.744 bln
-173.458 mln
-9.05%
jan 1, 2004
2.793 bln
+1.049 bln
60.17%
jan 1, 2005
3.69 bln
+896.934 mln
32.12%
jan 1, 2006
3.959 bln
+268.882 mln
7.29%
jan 1, 2007
4.045 bln
+85.839 mln
2.17%
jan 1, 2008
4.536 bln
+491.771 mln
12.16%
jan 1, 2009
4.278 bln
-258.531 mln
-5.7%
jan 1, 2010
4.86 bln
+582.238 mln
13.61%
jan 1, 2011
6.318 bln
+1.458 bln
29.99%
jan 1, 2012
7.0 bln
+682.275 mln
10.8%
jan 1, 2013
7.115 bln
+114.622 mln
1.64%
jan 1, 2014
7.121 bln
+6.859 mln
0.1%
jan 1, 2015
7.248 bln
+126.631 mln
1.78%
jan 1, 2016
6.555 bln
-693.0 mln
-9.56%
Ranking of countries by current statistics by years


Comments: