29
/
en
AIzaSyAYiBZKx7MnpbEhh9jyipgxe19OcubqV5w
April 1, 2024
47730
Lower middle income
LMC
false
2
1
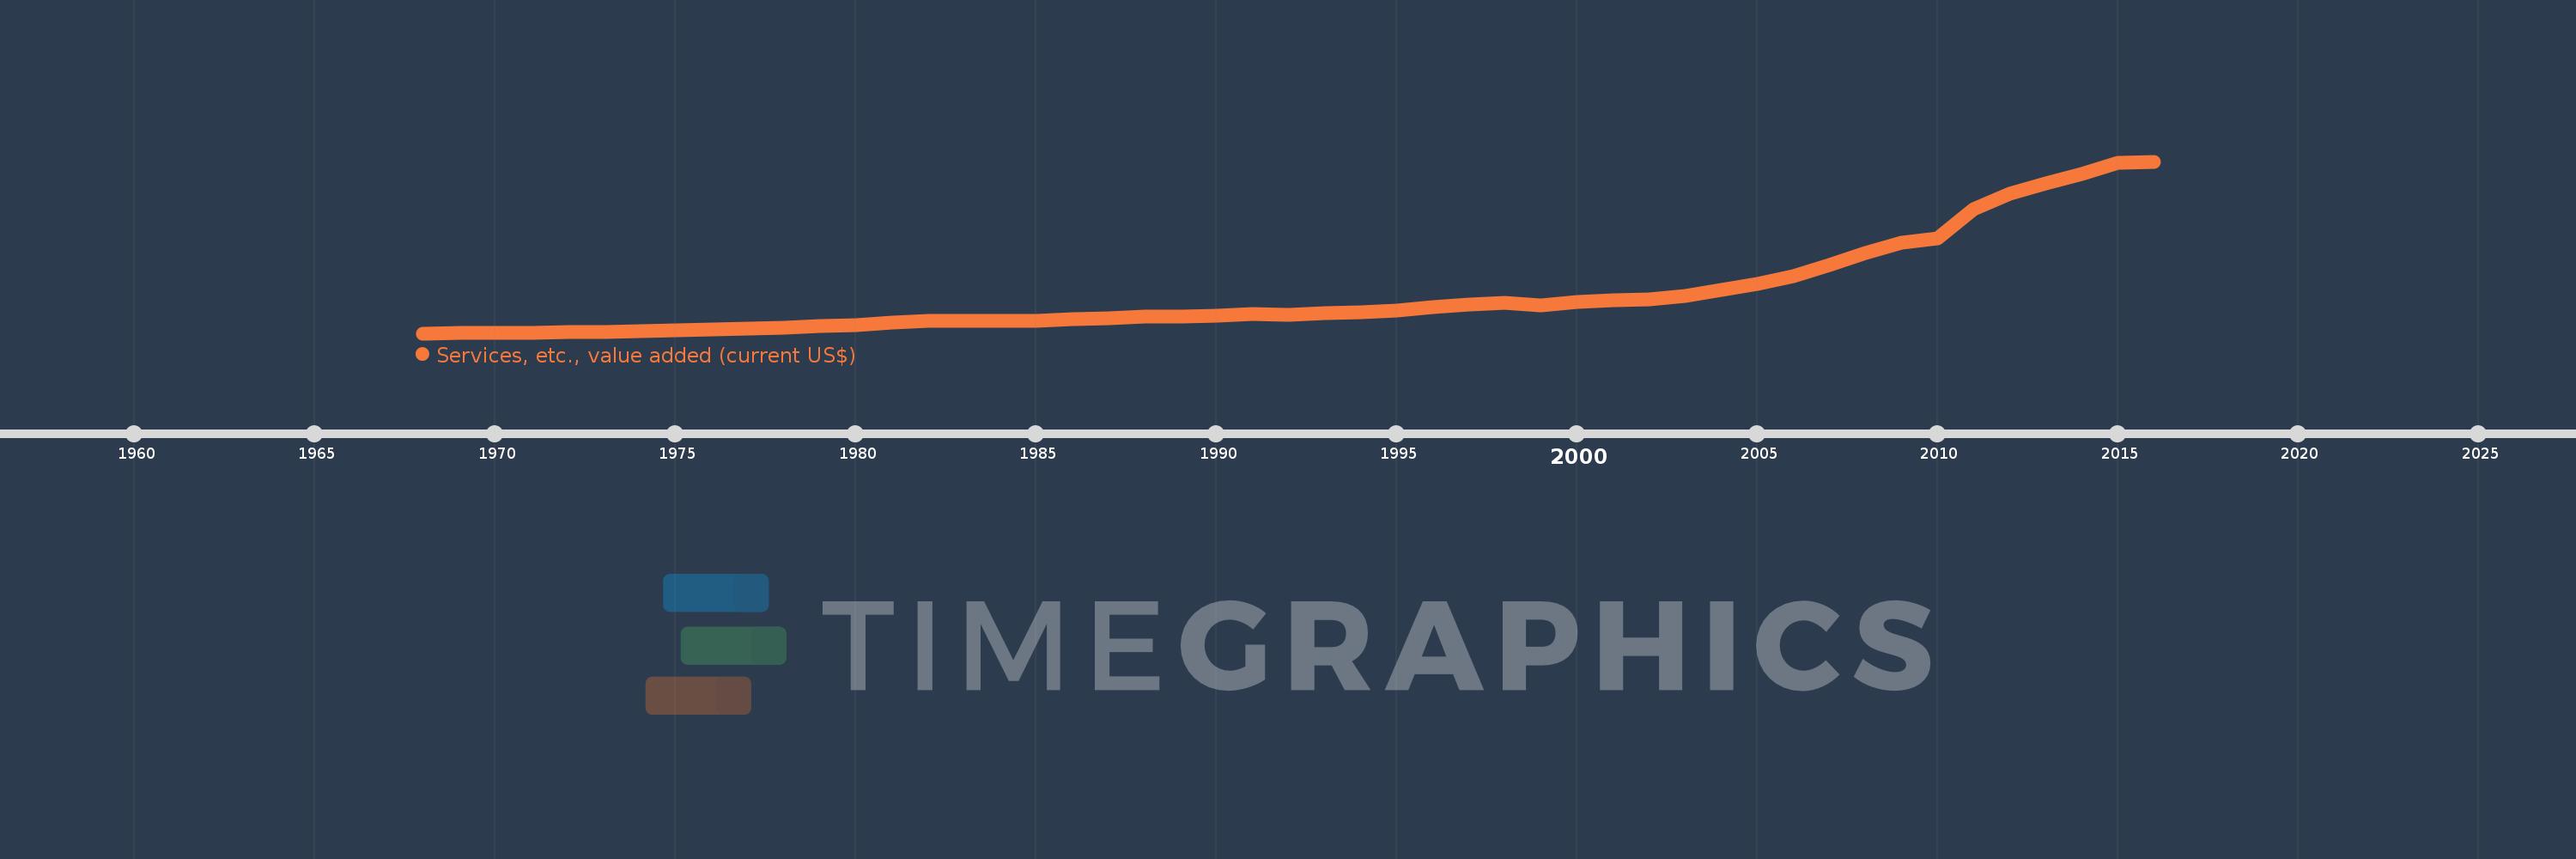
Services, etc., value added (current US$)
2016,2015,2014,2013,2012,2011,2010,2009,2008,2007,2006,2005,2004,2003,2002,2001,2000,1999,1998,1997,1996,1995,1994,1993,1992,1991,1990,1989,1988,1987,1986,1985,1984,1983,1982,1981,1980,1979,1978,1977,1976,1975,1974,1973,1972,1971,1970,1969,1968
This statistics in other country:
AfghanistanAlbaniaAlgeriaAndorraAngolaAntigua and BarbudaArab WorldArgentinaArmeniaArubaAustraliaAustriaAzerbaijanBahamas, TheBahrainBangladeshBarbadosBelarusBelgiumBelizeBeninBermudaBhutanBoliviaBosnia and HerzegovinaBotswanaBrazilBrunei DarussalamBulgariaBurkina FasoBurundiCabo VerdeCambodiaCameroonCanadaCaribbean small statesCentral African RepublicCentral Europe and the BalticsChadChileChinaColombiaComorosCongo, Dem. Rep.Congo, Rep.Costa RicaCote d'IvoireCroatiaCubaCyprusCzech RepublicDenmarkDjiboutiDominicaDominican RepublicEarly-demographic dividendEast Asia & PacificEast Asia & Pacific (excluding high income)East Asia & Pacific (IDA & IBRD countries)EcuadorEgypt, Arab Rep.El SalvadorEquatorial GuineaEritreaEstoniaEthiopiaEuro areaEurope & Central AsiaEurope & Central Asia (excluding high income)Europe & Central Asia (IDA & IBRD countries)European UnionFaroe IslandsFijiFinlandFragile and conflict affected situationsFranceGabonGambia, TheGeorgiaGermanyGhanaGreeceGrenadaGuatemalaGuineaGuinea-BissauGuyanaHeavily indebted poor countries (HIPC)High incomeHondurasHong Kong SAR, ChinaHungaryIBRD onlyIcelandIDA & IBRD totalIDA blendIDA onlyIDA totalIndiaIndonesiaIran, Islamic Rep.IraqIrelandItalyJamaicaJapanJordanKazakhstanKenyaKiribatiKorea, Rep.KosovoKuwaitKyrgyz RepublicLao PDRLate-demographic dividendLatin America & Caribbean Latin America & Caribbean (excluding high income)Latin America & the Caribbean (IDA & IBRD countries)LatviaLeast developed countries: UN classificationLebanonLesothoLiberiaLibyaLithuaniaLow & middle incomeLow incomeLower middle incomeLuxembourgMacao SAR, ChinaMacedonia, FYRMadagascarMalawiMalaysiaMaldivesMaliMaltaMarshall IslandsMauritaniaMauritiusMexicoMicronesia, Fed. Sts.Middle East & North AfricaMiddle East & North Africa (excluding high income)Middle East & North Africa (IDA & IBRD countries)Middle incomeMoldovaMongoliaMontenegroMoroccoMozambiqueMyanmarNamibiaNepalNetherlandsNew CaledoniaNew ZealandNicaraguaNigerNigeriaNorth AmericaNorwayOECD membersOmanOther small statesPacific island small statesPakistanPalauPanamaPapua New GuineaParaguayPeruPhilippinesPolandPortugalPost-demographic dividendPre-demographic dividendPuerto RicoQatarRomaniaRussian FederationRwandaSamoaSao Tome and PrincipeSaudi ArabiaSenegalSerbiaSeychellesSierra LeoneSingaporeSlovak RepublicSloveniaSmall statesSolomon IslandsSouth AfricaSouth AsiaSouth Asia (IDA & IBRD)SpainSri LankaSt. Kitts and NevisSt. LuciaSt. Vincent and the GrenadinesSub-Saharan Africa Sub-Saharan Africa (excluding high income)Sub-Saharan Africa (IDA & IBRD countries)SudanSurinameSwazilandSwedenSwitzerlandSyrian Arab RepublicTajikistanTanzaniaThailandTimor-LesteTogoTongaTrinidad and TobagoTunisiaTurkeyTurkmenistanTuvaluUgandaUkraineUnited Arab EmiratesUnited KingdomUnited StatesUpper middle incomeUruguayUzbekistanVanuatuVenezuela, RBVietnamWest Bank and GazaWorldYemen, Rep.ZambiaZimbabwe Timeline:
This timeline shows a graph from 1968 to 2016 of Lower middle income. No data until 1967. Number of actual observations by date: 49.
Source name:
World Development Indicators
Source organization:
World Bank national accounts data, and OECD National Accounts data files.
Categories, topics:
Economy & Growth
Last updated:
apr 23, 2017
Indicators value changes by year
Minimum:
49.697 bln
jan 1, 1968
Maximum:
2.893 trl
jan 1, 2016
At the date of observation
Value
Absolute change
Change from previous value
jan 1, 1968
49.697 bln
+49.697 bln
0.0%
jan 1, 1969
53.489 bln
+3.792 bln
7.63%
jan 1, 1970
58.371 bln
+4.882 bln
9.13%
jan 1, 1971
62.899 bln
+4.528 bln
7.76%
jan 1, 1972
68.311 bln
+5.412 bln
8.6%
jan 1, 1973
70.87 bln
+2.56 bln
3.75%
jan 1, 1974
81.886 bln
+11.016 bln
15.54%
jan 1, 1975
103.012 bln
+21.126 bln
25.8%
jan 1, 1976
117.059 bln
+14.047 bln
13.64%
jan 1, 1977
127.293 bln
+10.235 bln
8.74%
jan 1, 1978
147.895 bln
+20.602 bln
16.18%
jan 1, 1979
167.862 bln
+19.966 bln
13.5%
jan 1, 1980
190.739 bln
+22.878 bln
13.63%
jan 1, 1981
233.55 bln
+42.811 bln
22.44%
jan 1, 1982
250.294 bln
+16.744 bln
7.17%
jan 1, 1983
260.586 bln
+10.292 bln
4.11%
jan 1, 1984
254.658 bln
-5.929 bln
-2.28%
jan 1, 1985
256.174 bln
+1.516 bln
0.6%
jan 1, 1986
277.276 bln
+21.102 bln
8.24%
jan 1, 1987
291.985 bln
+14.709 bln
5.3%
jan 1, 1988
320.093 bln
+28.108 bln
9.63%
jan 1, 1989
328.683 bln
+8.589 bln
2.68%
jan 1, 1990
336.232 bln
+7.549 bln
2.3%
jan 1, 1991
363.014 bln
+26.782 bln
7.97%
jan 1, 1992
352.024 bln
-10.99 bln
-3.03%
jan 1, 1993
376.765 bln
+24.741 bln
7.03%
jan 1, 1994
396.53 bln
+19.765 bln
5.25%
jan 1, 1995
426.648 bln
+30.118 bln
7.6%
jan 1, 1996
483.283 bln
+56.636 bln
13.27%
jan 1, 1997
529.368 bln
+46.085 bln
9.54%
jan 1, 1998
557.638 bln
+28.27 bln
5.34%
jan 1, 1999
516.201 bln
-41.437 bln
-7.43%
jan 1, 2000
564.256 bln
+48.055 bln
9.31%
jan 1, 2001
596.959 bln
+32.703 bln
5.8%
jan 1, 2002
613.306 bln
+16.347 bln
2.74%
jan 1, 2003
662.774 bln
+49.468 bln
8.07%
jan 1, 2004
764.728 bln
+101.954 bln
15.38%
jan 1, 2005
868.912 bln
+104.185 bln
13.62%
jan 1, 2006
1.001 trl
+132.343 bln
15.23%
jan 1, 2007
1.184 trl
+183.197 bln
18.3%
jan 1, 2008
1.373 trl
+188.413 bln
15.91%
jan 1, 2009
1.547 trl
+174.097 bln
12.68%
jan 1, 2010
1.624 trl
+76.987 bln
4.98%
jan 1, 2011
2.107 trl
+483.519 bln
29.77%
jan 1, 2012
2.366 trl
+258.379 bln
12.26%
jan 1, 2013
2.526 trl
+159.725 bln
6.75%
jan 1, 2014
2.682 trl
+156.015 bln
6.18%
jan 1, 2015
2.869 trl
+187.2 bln
6.98%
jan 1, 2016
2.893 trl
+24.696 bln
0.86%
Ranking of countries by current statistics by years


Comments: