29
/
en
AIzaSyAYiBZKx7MnpbEhh9jyipgxe19OcubqV5w
April 1, 2024
85978
Bhutan
BTN
true
2
1
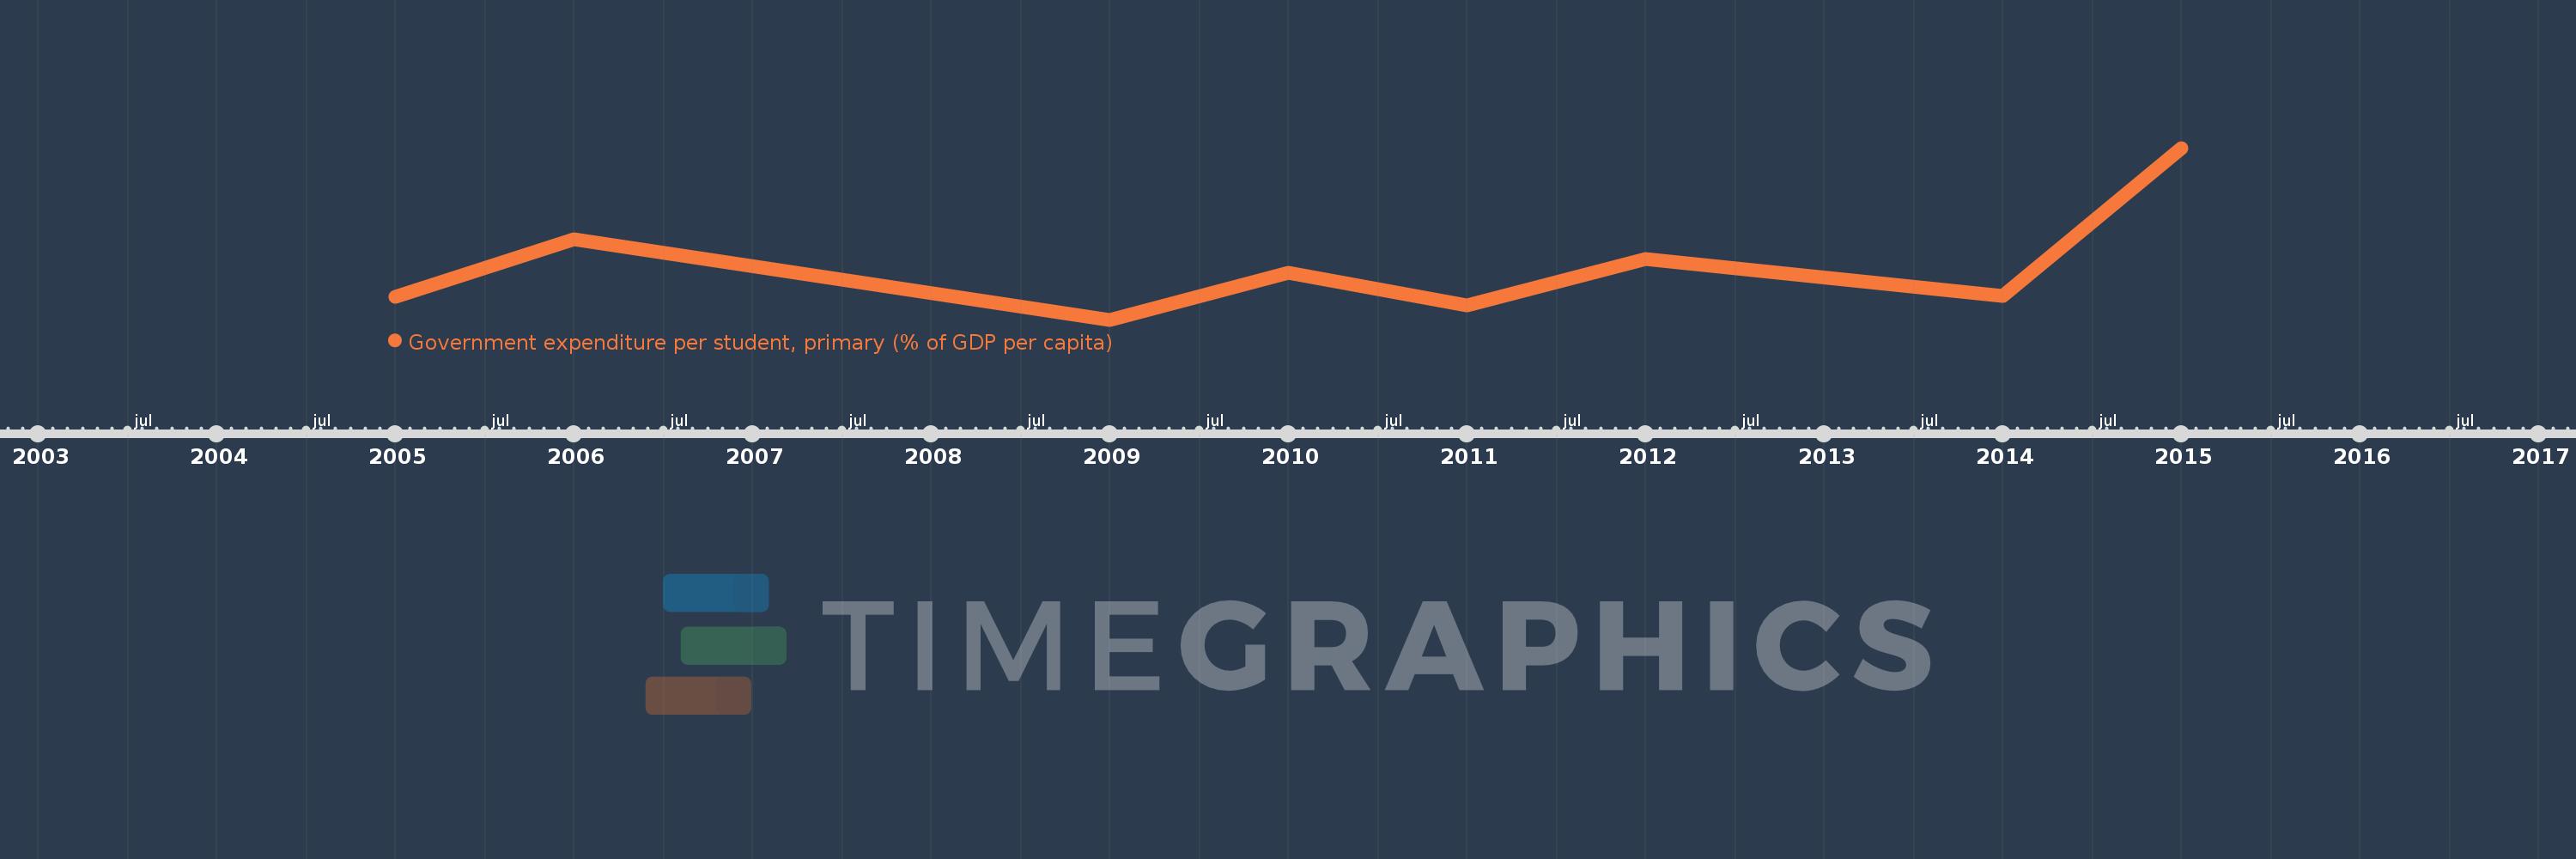
Government expenditure per student, primary (% of GDP per capita)
2015,2014,2012,2011,2010,2009,2006,2005
This statistics in other country:
Timeline:
This timeline shows a graph from 2005 to 2015 of Bhutan. No data until 2004. Number of actual observations by date: 8.
Source name:
World Development Indicators
Source organization:
United Nations Educational, Scientific, and Cultural Organization (UNESCO) Institute for Statistics.
Categories, topics:
Education
Last updated:
apr 23, 2017
Indicators value changes by year
Maximum:
13.652
jan 1, 2015
At the date of observation
Value
Absolute change
Change from previous value
jan 1, 2005
8.153
+8.153
0.0%
jan 1, 2006
10.294
+2.141
26.27%
jan 1, 2009
7.314
-2.98
-28.95%
jan 1, 2010
9.033
+1.719
23.5%
jan 1, 2011
7.834
-1.198
-13.27%
jan 1, 2012
9.568
+1.733
22.13%
jan 1, 2014
8.203
-1.364
-14.26%
jan 1, 2015
13.652
+5.449
66.42%
Ranking of countries by current statistics by years


Comments: