29
/
en
AIzaSyAYiBZKx7MnpbEhh9jyipgxe19OcubqV5w
April 1, 2024
122164
Dominican Republic
DOM
true
2
1
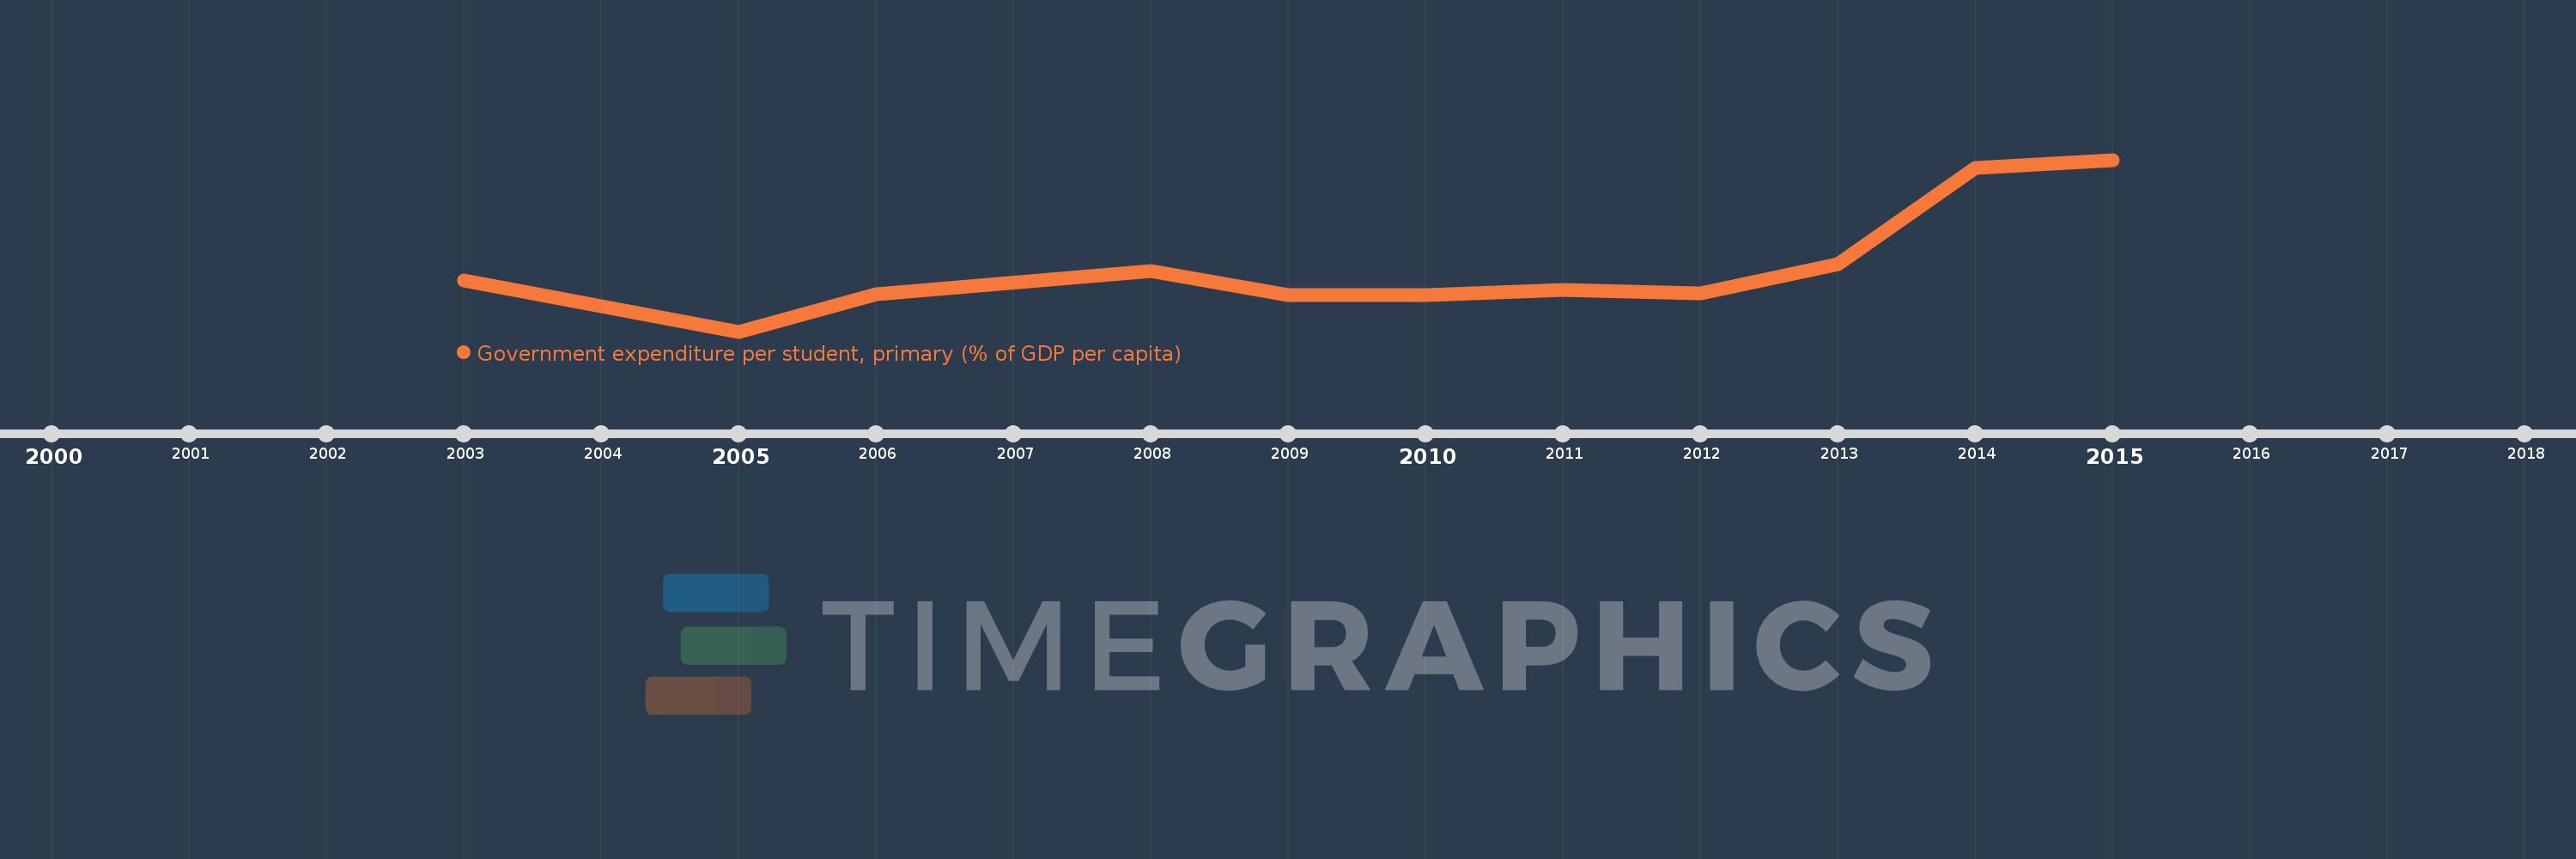
Government expenditure per student, primary (% of GDP per capita)
2015,2014,2013,2012,2011,2010,2009,2008,2006,2005,2003
This statistics in other country:
Timeline:
This timeline shows a graph from 2003 to 2015 of Dominican Republic. No data until 2002. Number of actual observations by date: 11.
Source name:
World Development Indicators
Source organization:
United Nations Educational, Scientific, and Cultural Organization (UNESCO) Institute for Statistics.
Categories, topics:
Education
Last updated:
apr 23, 2017
Indicators value changes by year
Maximum:
15.614
jan 1, 2015
At the date of observation
Value
Absolute change
Change from previous value
jan 1, 2003
7.806
+7.806
0.0%
jan 1, 2005
4.536
-3.27
-41.89%
jan 1, 2006
6.939
+2.403
52.97%
jan 1, 2008
8.442
+1.503
21.66%
jan 1, 2009
6.864
-1.578
-18.69%
jan 1, 2010
6.891
+0.026
0.38%
jan 1, 2011
7.218
+0.328
4.75%
jan 1, 2012
6.993
-0.225
-3.12%
jan 1, 2013
8.88
+1.887
26.98%
jan 1, 2014
15.107
+6.227
70.12%
jan 1, 2015
15.614
+0.507
3.35%
Ranking of countries by current statistics by years


Comments: