29
/
en
AIzaSyAYiBZKx7MnpbEhh9jyipgxe19OcubqV5w
April 1, 2024
25723
Central Europe and the Baltics
CEB
false
2
1
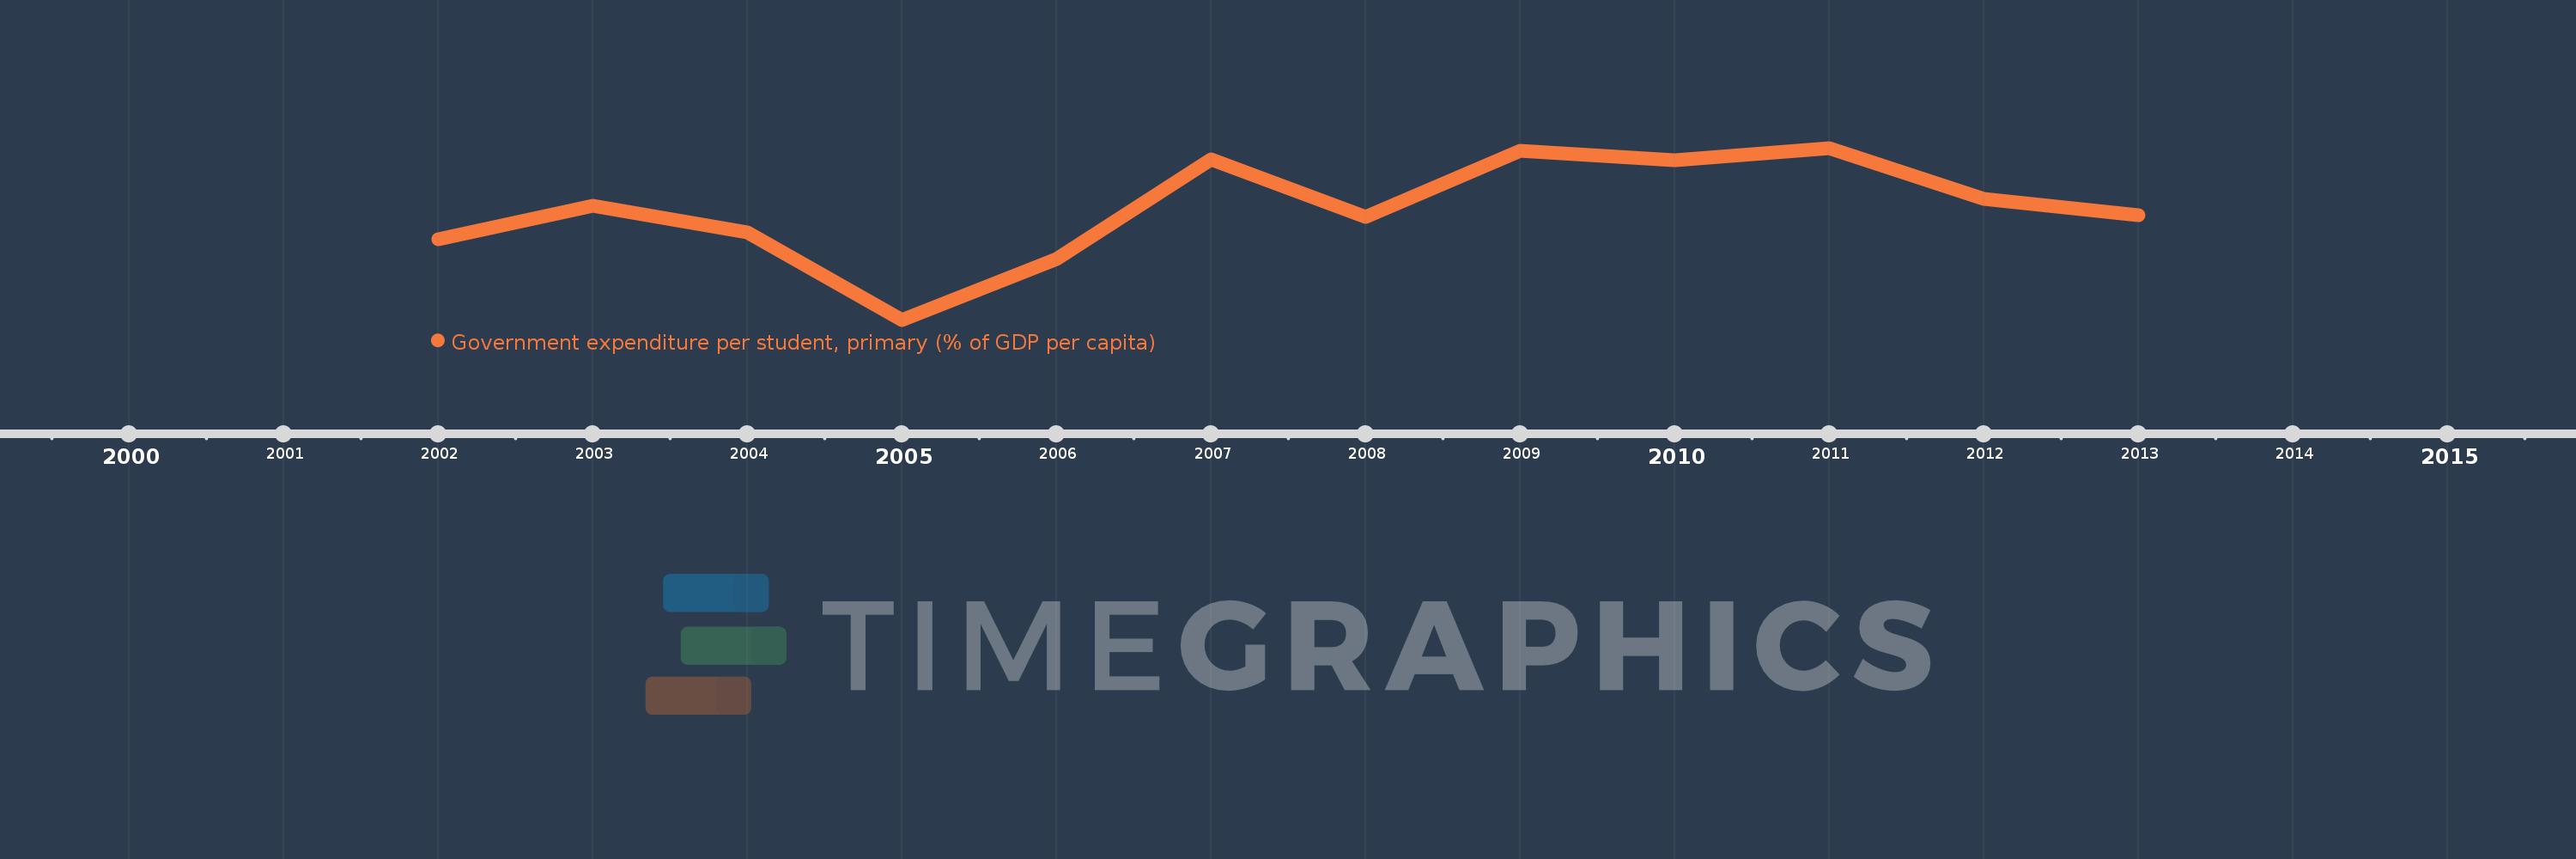
Government expenditure per student, primary (% of GDP per capita)
2013,2012,2011,2010,2009,2008,2007,2006,2005,2004,2003,2002
This statistics in other country:
Timeline:
This timeline shows a graph from 2002 to 2013 of Central Europe and the Baltics. No data until 2001. Number of actual observations by date: 12.
Source name:
World Development Indicators
Source organization:
United Nations Educational, Scientific, and Cultural Organization (UNESCO) Institute for Statistics.
Categories, topics:
Education
Last updated:
apr 23, 2017
Indicators value changes by year
Maximum:
22.236
jan 1, 2011
At the date of observation
Value
Absolute change
Change from previous value
jan 1, 2002
18.233
+18.233
0.0%
jan 1, 2003
19.708
+1.475
8.09%
jan 1, 2004
18.532
-1.177
-5.97%
jan 1, 2005
14.68
-3.852
-20.79%
jan 1, 2006
17.343
+2.664
18.14%
jan 1, 2007
21.747
+4.404
25.39%
jan 1, 2008
19.192
-2.556
-11.75%
jan 1, 2009
22.12
+2.928
15.26%
jan 1, 2010
21.7
-0.42
-1.9%
jan 1, 2011
22.236
+0.536
2.47%
jan 1, 2012
19.987
-2.249
-10.12%
jan 1, 2013
19.278
-0.709
-3.54%
Ranking of countries by current statistics by years


Comments: