29
/
en
AIzaSyAYiBZKx7MnpbEhh9jyipgxe19OcubqV5w
April 1, 2024
207976
Netherlands
NLD
true
2
1
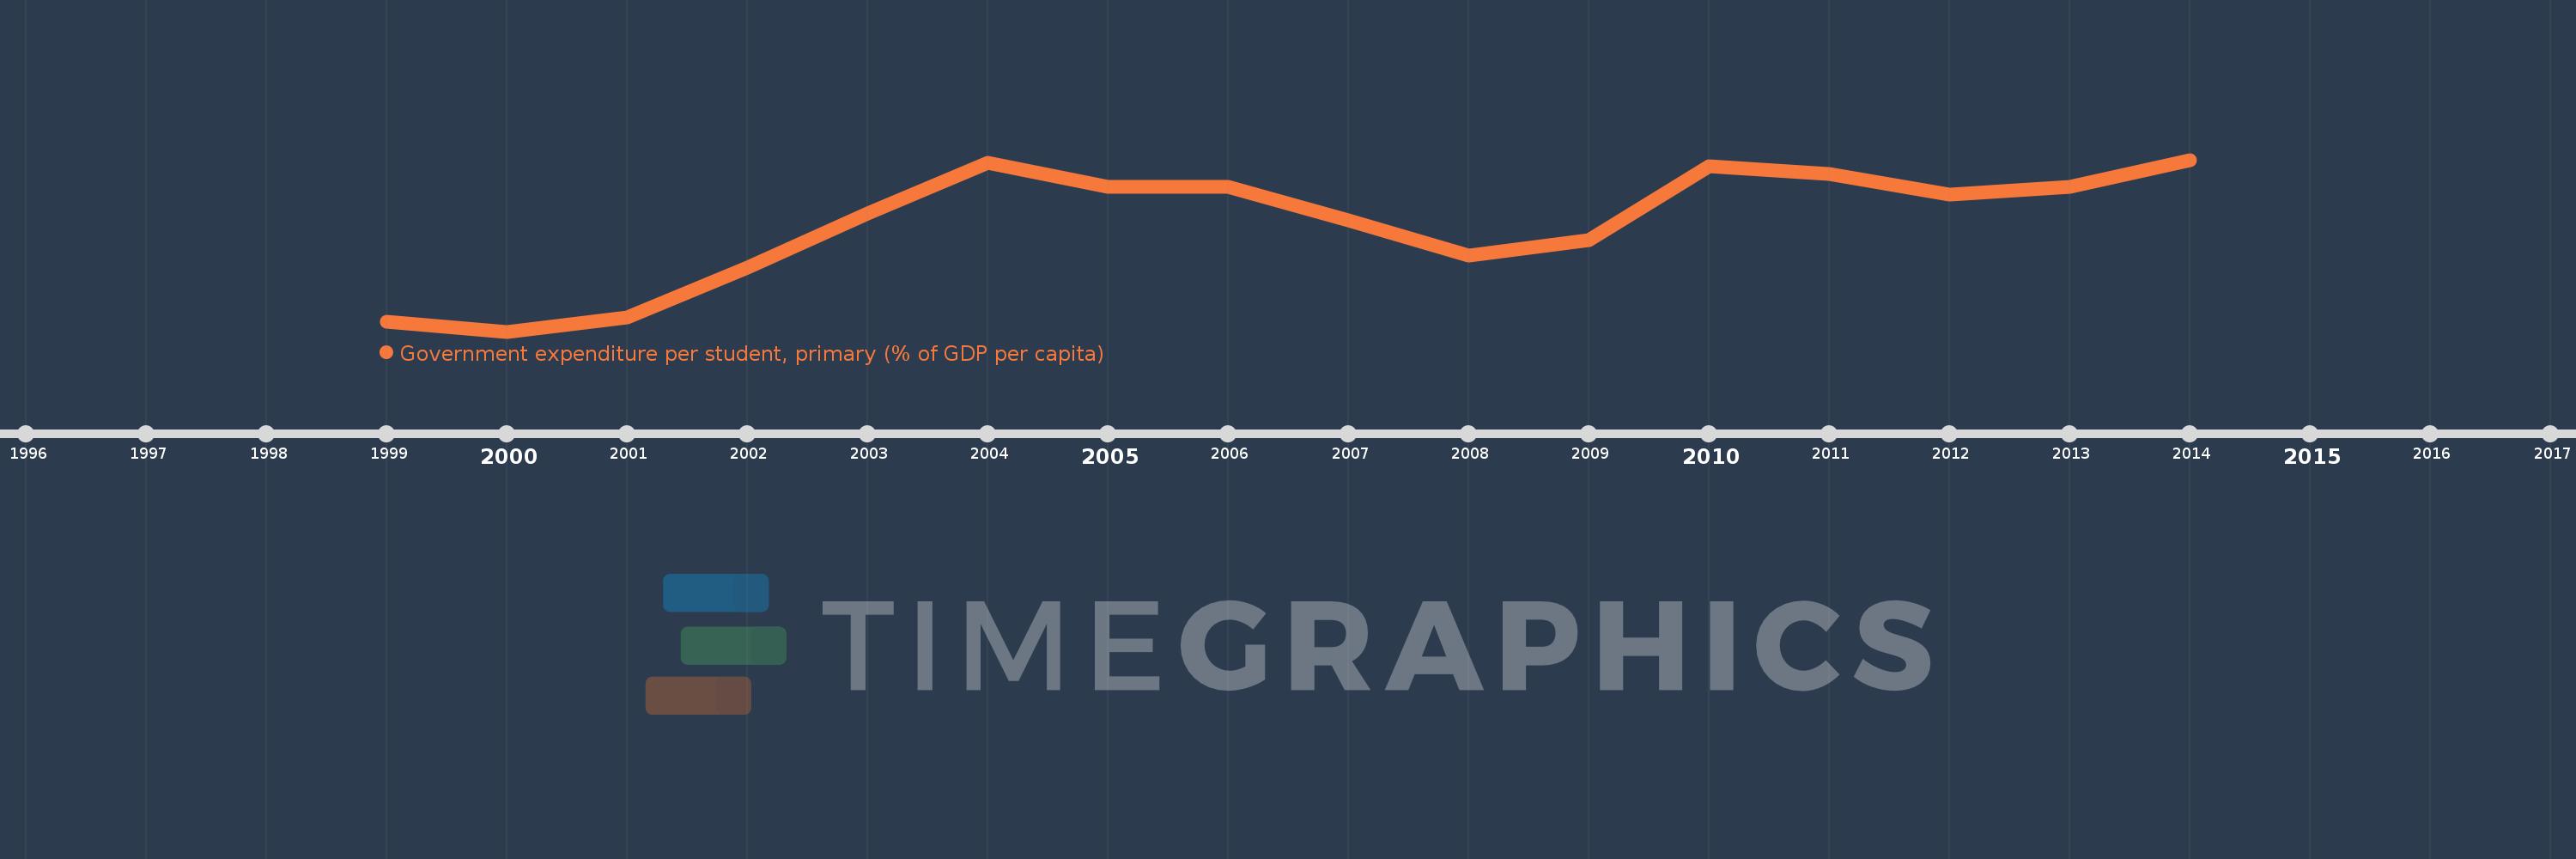
Government expenditure per student, primary (% of GDP per capita)
2014,2013,2012,2011,2010,2009,2008,2007,2006,2005,2004,2003,2002,2001,2000,1999
This statistics in other country:
Timeline:
This timeline shows a graph from 1999 to 2014 of Netherlands. No data until 1998. Number of actual observations by date: 16.
Source name:
World Development Indicators
Source organization:
United Nations Educational, Scientific, and Cultural Organization (UNESCO) Institute for Statistics.
Categories, topics:
Education
Last updated:
apr 23, 2017
Indicators value changes by year
Minimum:
14.113
jan 1, 2000
Maximum:
17.635
jan 1, 2014
At the date of observation
Value
Absolute change
Change from previous value
jan 1, 1999
14.316
+14.316
0.0%
jan 1, 2000
14.113
-0.203
-1.41%
jan 1, 2001
14.407
+0.293
2.08%
jan 1, 2002
15.417
+1.01
7.01%
jan 1, 2003
16.538
+1.121
7.27%
jan 1, 2004
17.566
+1.028
6.21%
jan 1, 2005
17.081
-0.484
-2.76%
jan 1, 2006
17.073
-0.008
-0.05%
jan 1, 2007
16.387
-0.686
-4.02%
jan 1, 2008
15.675
-0.712
-4.35%
jan 1, 2009
15.997
+0.323
2.06%
jan 1, 2010
17.511
+1.514
9.46%
jan 1, 2011
17.342
-0.169
-0.96%
jan 1, 2012
16.922
-0.42
-2.42%
jan 1, 2013
17.074
+0.152
0.9%
jan 1, 2014
17.635
+0.561
3.29%
Ranking of countries by current statistics by years


Comments: