29
/
en
AIzaSyAYiBZKx7MnpbEhh9jyipgxe19OcubqV5w
April 1, 2024
177711
Lesotho
LSO
true
2
1
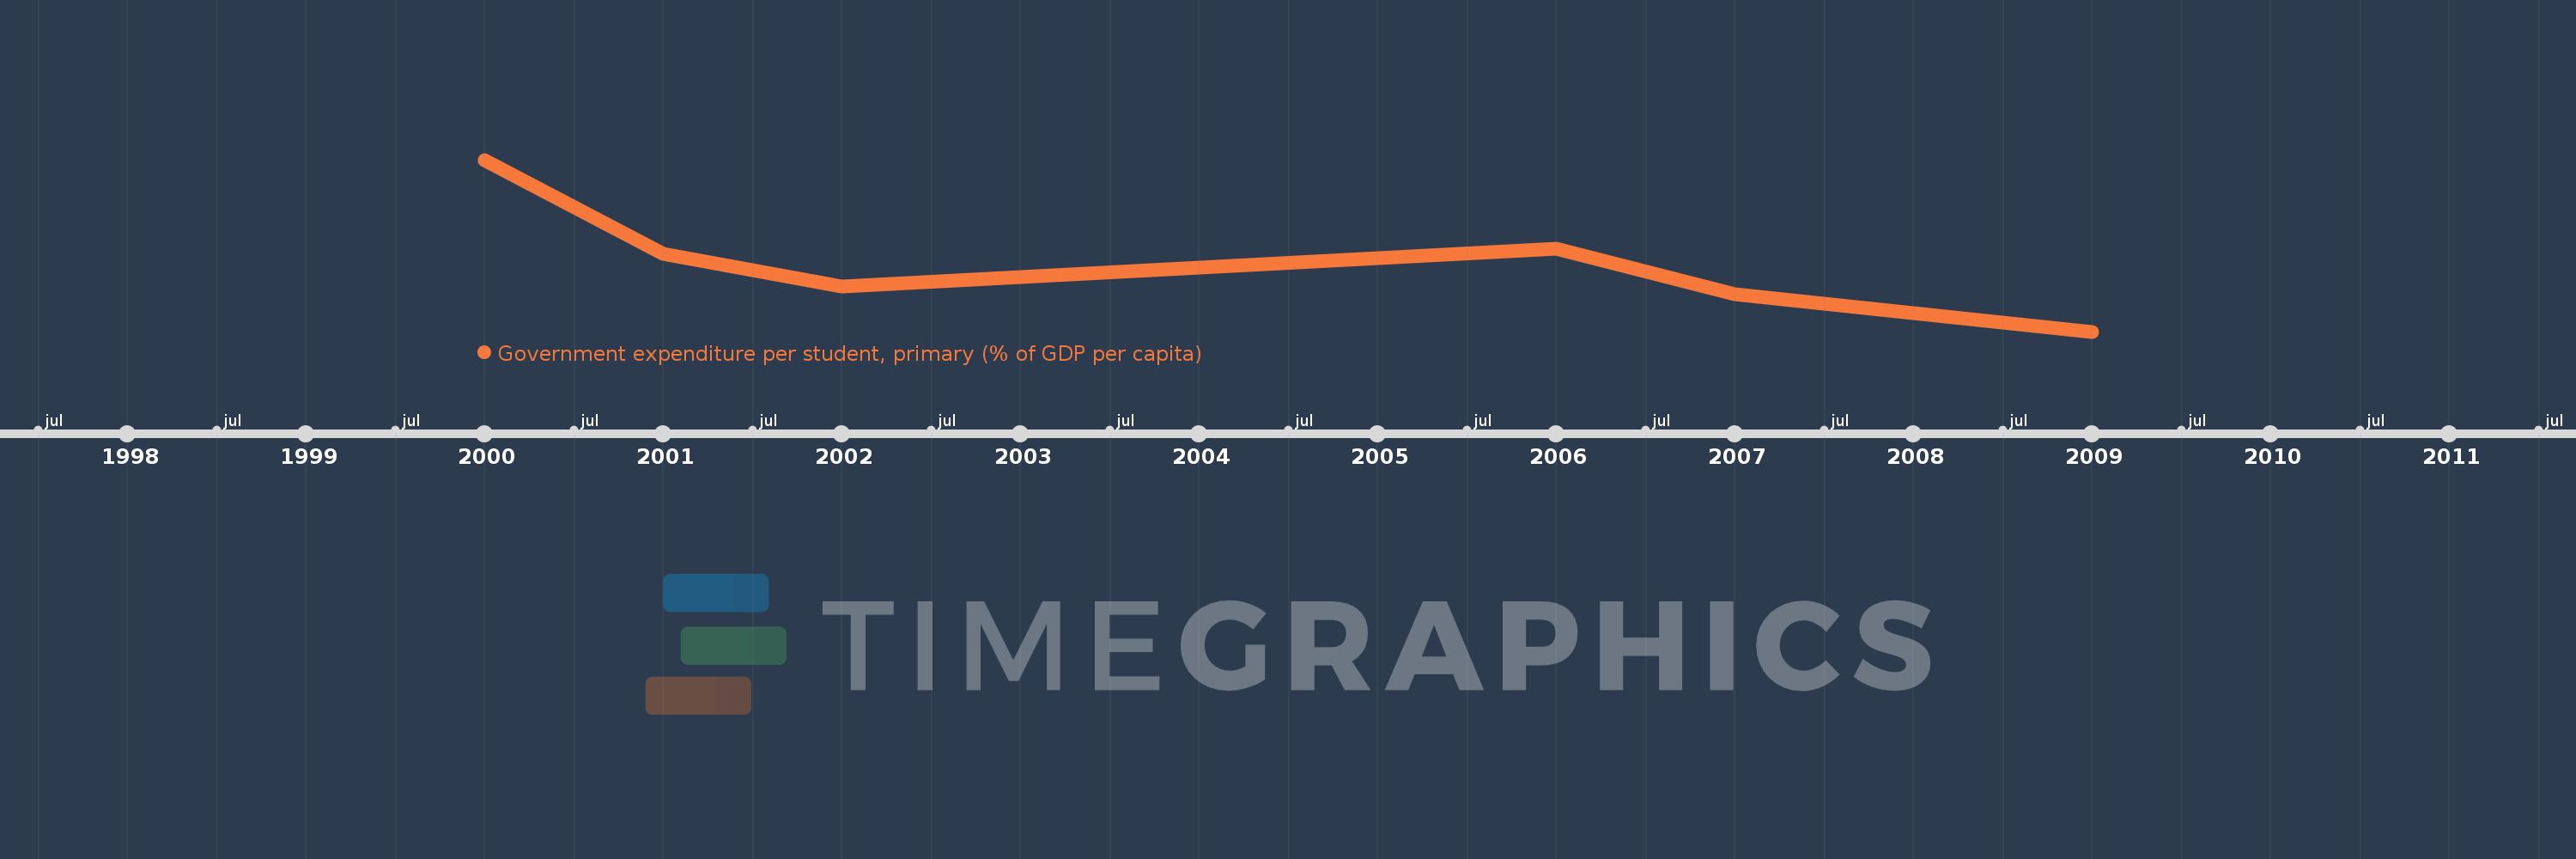
Government expenditure per student, primary (% of GDP per capita)
2009,2007,2006,2002,2001,2000
This statistics in other country:
Timeline:
This timeline shows a graph from 2000 to 2009 of Lesotho. No data until 1999. Number of actual observations by date: 6.
Source name:
World Development Indicators
Source organization:
United Nations Educational, Scientific, and Cultural Organization (UNESCO) Institute for Statistics.
Categories, topics:
Education
Last updated:
apr 23, 2017
Indicators value changes by year
Minimum:
22.792
jan 1, 2009
Maximum:
34.658
jan 1, 2000
At the date of observation
Value
Absolute change
Change from previous value
jan 1, 2000
34.658
+34.658
0.0%
jan 1, 2001
28.175
-6.482
-18.7%
jan 1, 2002
25.916
-2.259
-8.02%
jan 1, 2006
28.503
+2.587
9.98%
jan 1, 2007
25.359
-3.144
-11.03%
jan 1, 2009
22.792
-2.567
-10.12%
Ranking of countries by current statistics by years


Comments: