29
/
en
AIzaSyAYiBZKx7MnpbEhh9jyipgxe19OcubqV5w
April 1, 2024
199178
Mongolia
MNG
true
2
1
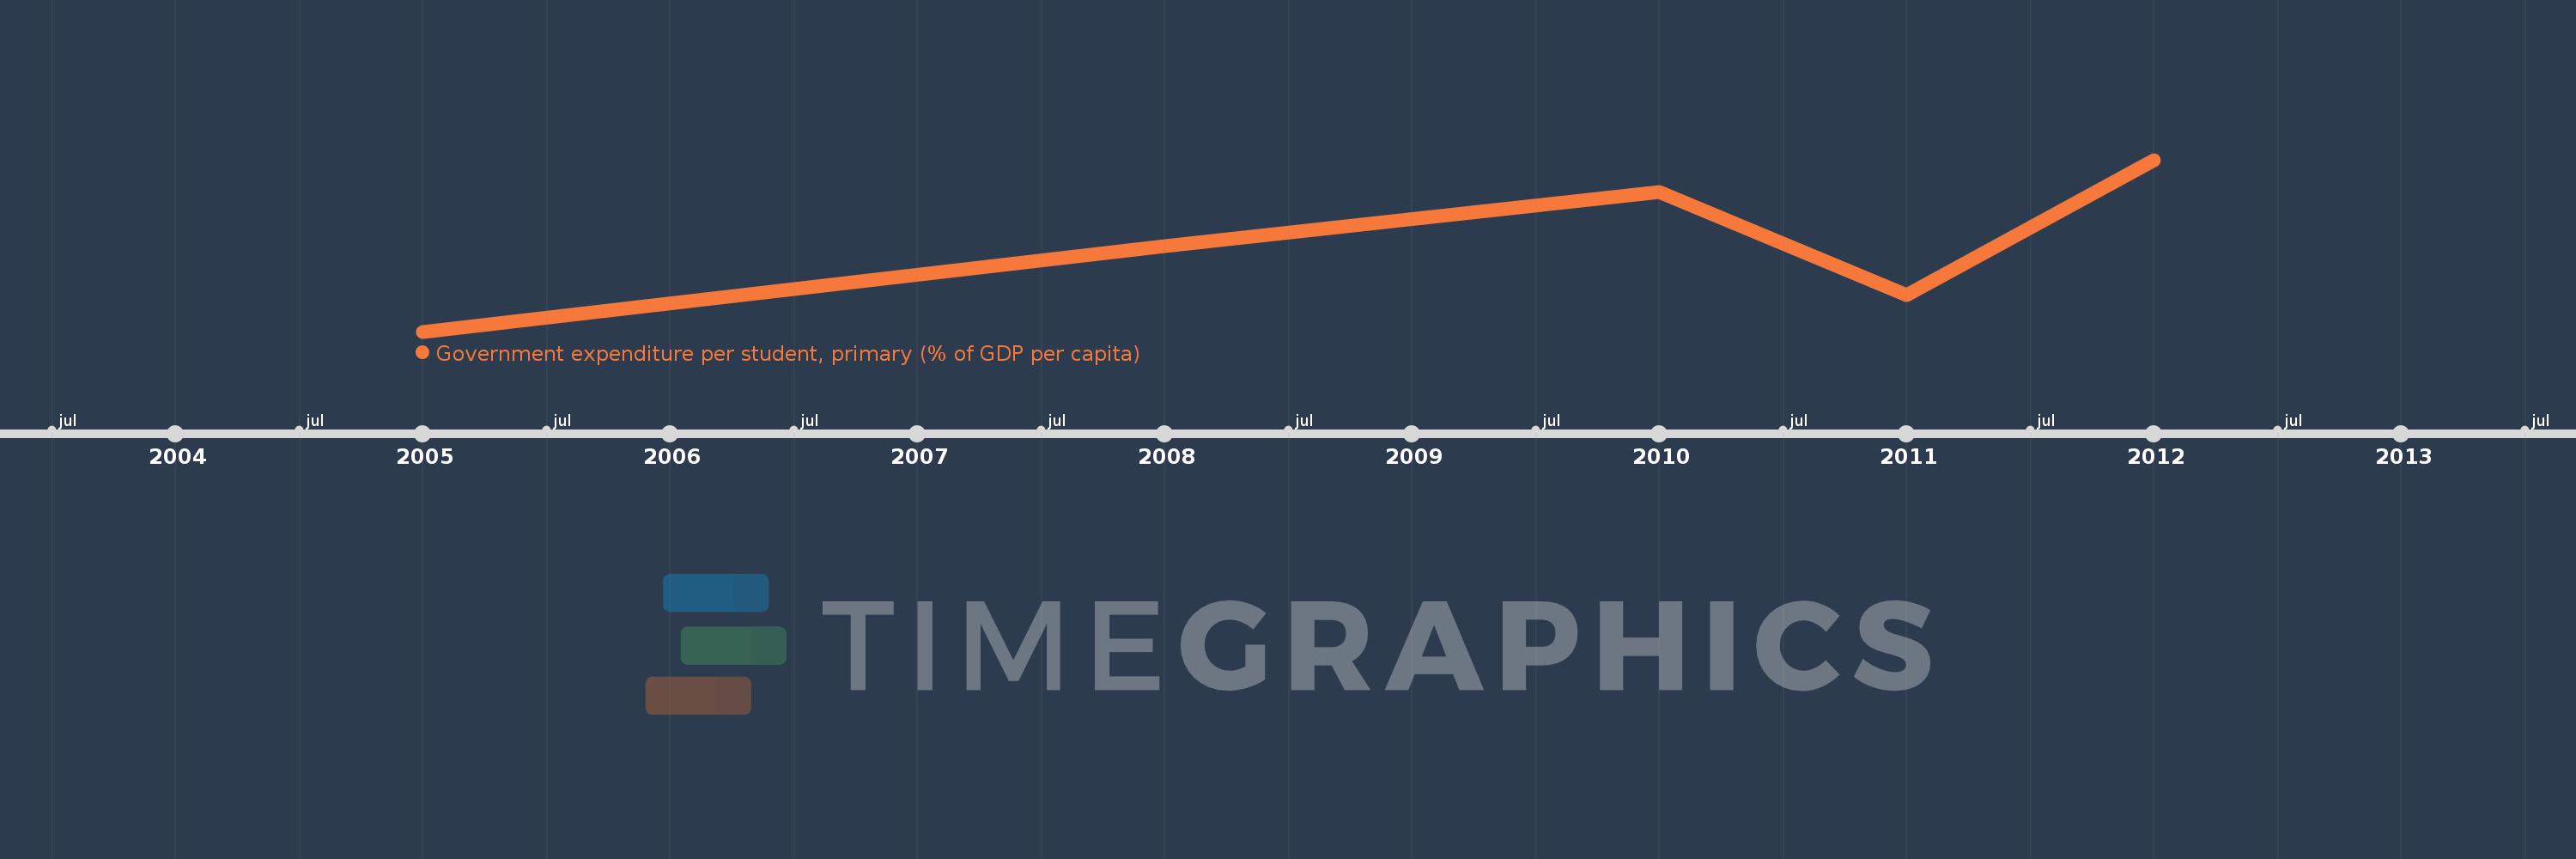
Government expenditure per student, primary (% of GDP per capita)
2012,2011,2010,2008,2005
This statistics in other country:
Timeline:
This timeline shows a graph from 2005 to 2012 of Mongolia. No data until 2004. Number of actual observations by date: 5.
Source name:
World Development Indicators
Source organization:
United Nations Educational, Scientific, and Cultural Organization (UNESCO) Institute for Statistics.
Categories, topics:
Education
Last updated:
apr 23, 2017
Indicators value changes by year
Minimum:
11.485
jan 1, 2005
Maximum:
15.671
jan 1, 2012
At the date of observation
Value
Absolute change
Change from previous value
jan 1, 2005
11.485
+11.485
0.0%
jan 1, 2008
13.577
+2.093
18.22%
jan 1, 2010
14.887
+1.309
9.64%
jan 1, 2011
12.37
-2.516
-16.9%
jan 1, 2012
15.671
+3.301
26.68%
Ranking of countries by current statistics by years


Comments: