29
/
en
AIzaSyAYiBZKx7MnpbEhh9jyipgxe19OcubqV5w
April 1, 2024
52636
OECD members
OED
false
2
1
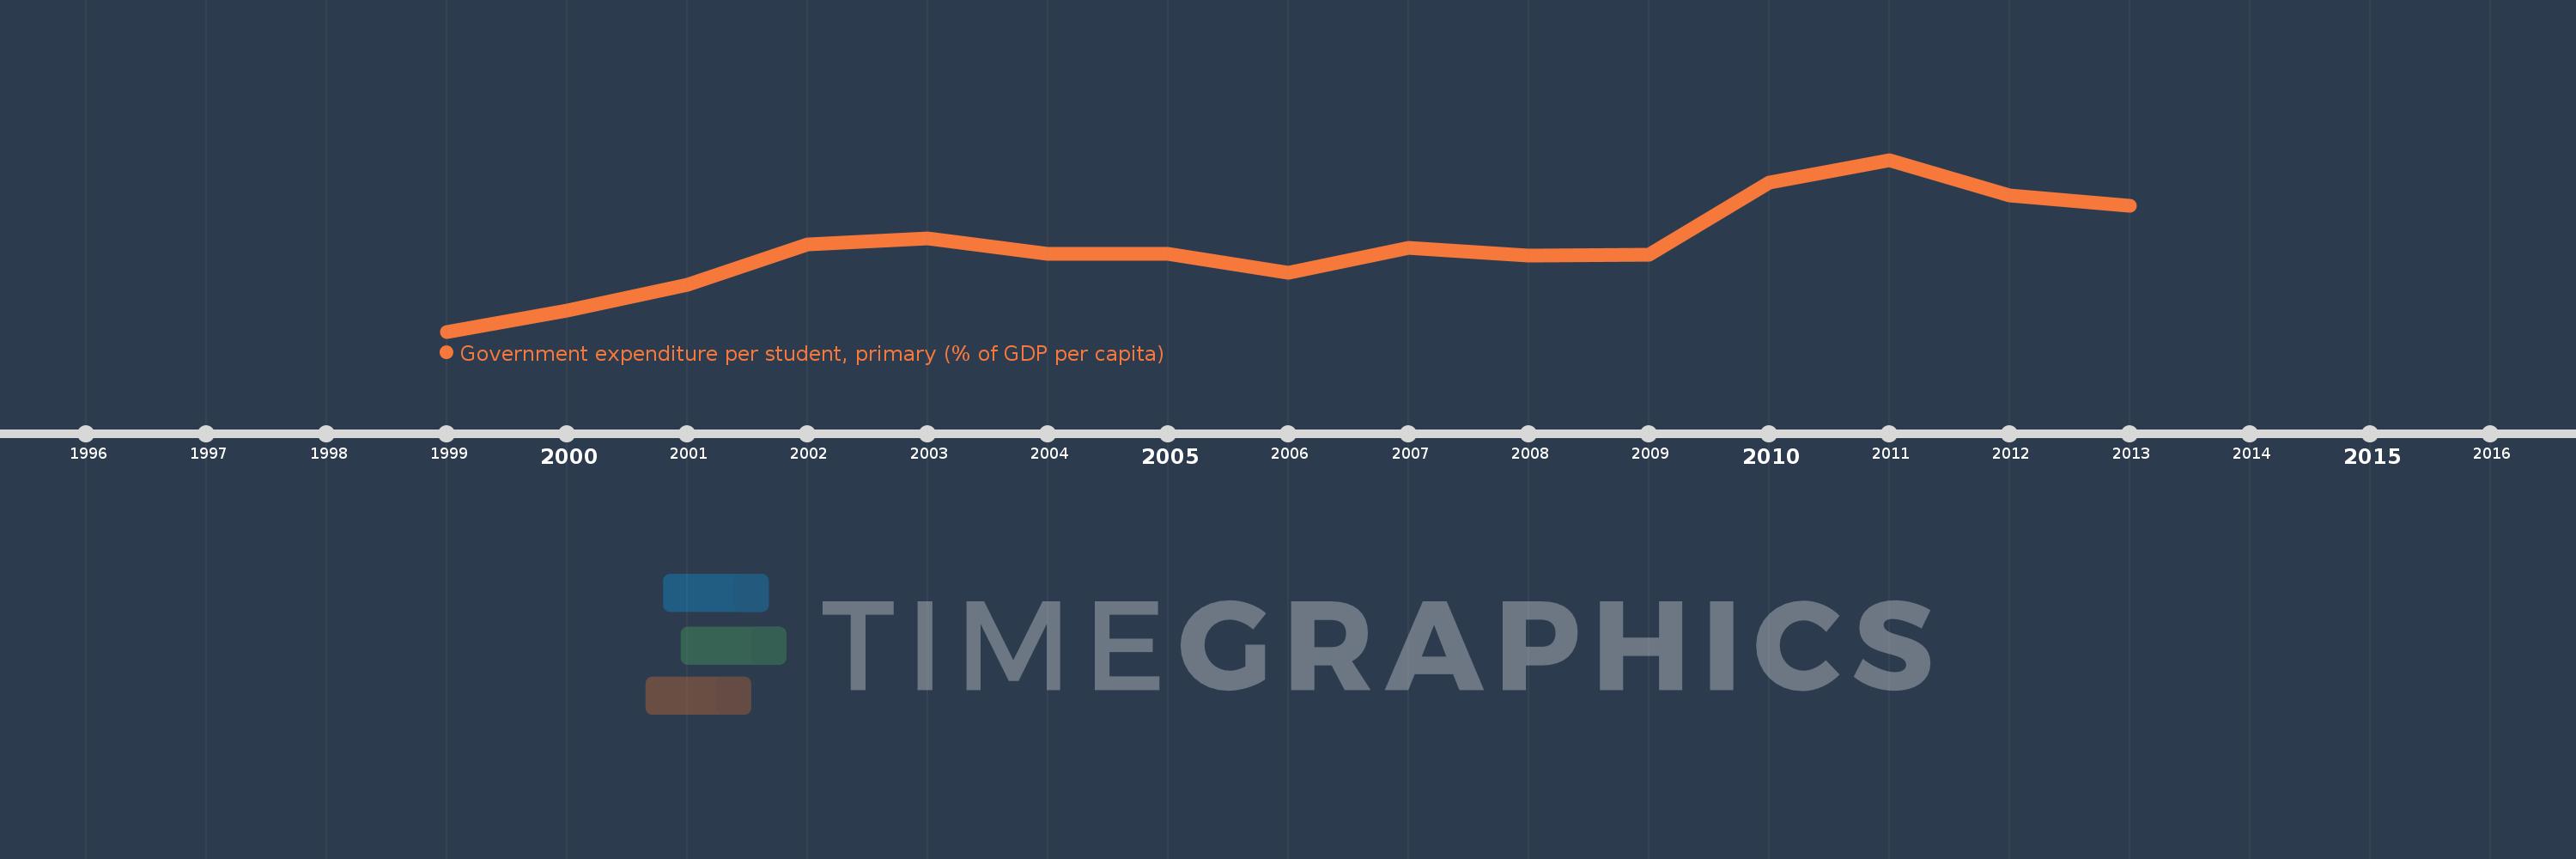
Government expenditure per student, primary (% of GDP per capita)
2013,2012,2011,2010,2009,2008,2007,2006,2005,2004,2003,2002,2001,2000,1999
This statistics in other country:
Timeline:
This timeline shows a graph from 1999 to 2013 of OECD members. No data until 1998. Number of actual observations by date: 15.
Source name:
World Development Indicators
Source organization:
United Nations Educational, Scientific, and Cultural Organization (UNESCO) Institute for Statistics.
Categories, topics:
Education
Last updated:
apr 23, 2017
Indicators value changes by year
Minimum:
16.984
jan 1, 1999
Maximum:
21.987
jan 1, 2011
At the date of observation
Value
Absolute change
Change from previous value
jan 1, 1999
16.984
+16.984
0.0%
jan 1, 2000
17.6
+0.616
3.63%
jan 1, 2001
18.346
+0.746
4.24%
jan 1, 2002
19.522
+1.176
6.41%
jan 1, 2003
19.708
+0.187
0.96%
jan 1, 2004
19.241
-0.468
-2.37%
jan 1, 2005
19.243
+0.002
0.01%
jan 1, 2006
18.7
-0.542
-2.82%
jan 1, 2007
19.422
+0.721
3.86%
jan 1, 2008
19.192
-0.23
-1.18%
jan 1, 2009
19.222
+0.03
0.16%
jan 1, 2010
21.315
+2.093
10.89%
jan 1, 2011
21.987
+0.672
3.15%
jan 1, 2012
20.955
-1.032
-4.69%
jan 1, 2013
20.649
-0.306
-1.46%
Ranking of countries by current statistics by years


Comments: