29
/
en
AIzaSyAYiBZKx7MnpbEhh9jyipgxe19OcubqV5w
April 1, 2024
84126
Benin
BEN
true
2
1
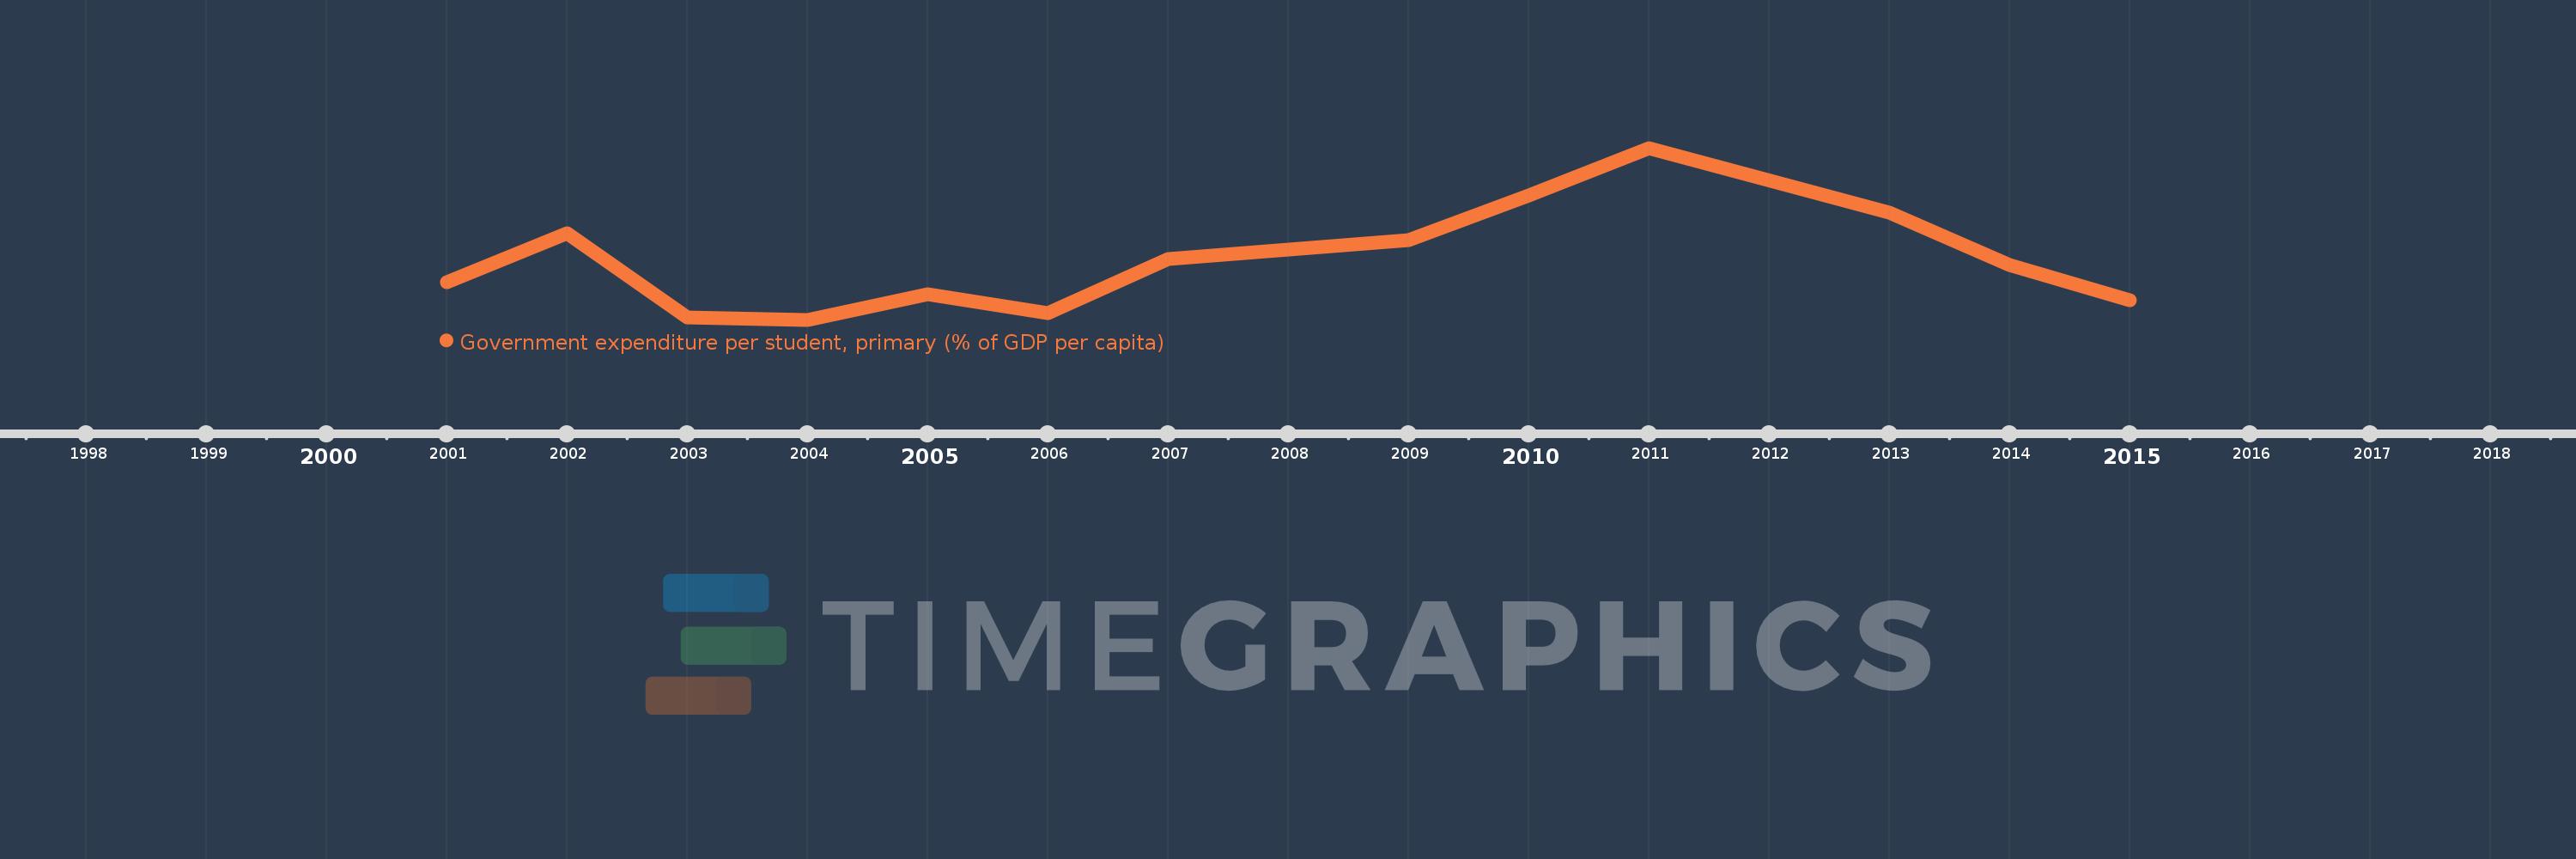
Government expenditure per student, primary (% of GDP per capita)
2015,2014,2013,2011,2010,2009,2007,2006,2005,2004,2003,2002,2001
This statistics in other country:
Timeline:
This timeline shows a graph from 2001 to 2015 of Benin. No data until 2000. Number of actual observations by date: 13.
Source name:
World Development Indicators
Source organization:
United Nations Educational, Scientific, and Cultural Organization (UNESCO) Institute for Statistics.
Categories, topics:
Education
Last updated:
apr 23, 2017
Indicators value changes by year
Maximum:
14.131
jan 1, 2011
At the date of observation
Value
Absolute change
Change from previous value
jan 1, 2001
11.061
+11.061
0.0%
jan 1, 2002
12.174
+1.113
10.06%
jan 1, 2003
10.247
-1.926
-15.82%
jan 1, 2004
10.2
-0.048
-0.46%
jan 1, 2005
10.782
+0.583
5.71%
jan 1, 2006
10.361
-0.422
-3.91%
jan 1, 2007
11.597
+1.236
11.93%
jan 1, 2009
12.016
+0.419
3.62%
jan 1, 2010
13.04
+1.024
8.52%
jan 1, 2011
14.131
+1.091
8.37%
jan 1, 2013
12.643
-1.488
-10.53%
jan 1, 2014
11.458
-1.185
-9.37%
jan 1, 2015
10.651
-0.807
-7.04%
Ranking of countries by current statistics by years


Comments: