29
/
en
AIzaSyAYiBZKx7MnpbEhh9jyipgxe19OcubqV5w
April 1, 2024
40732
Late-demographic dividend
LTE
false
2
1
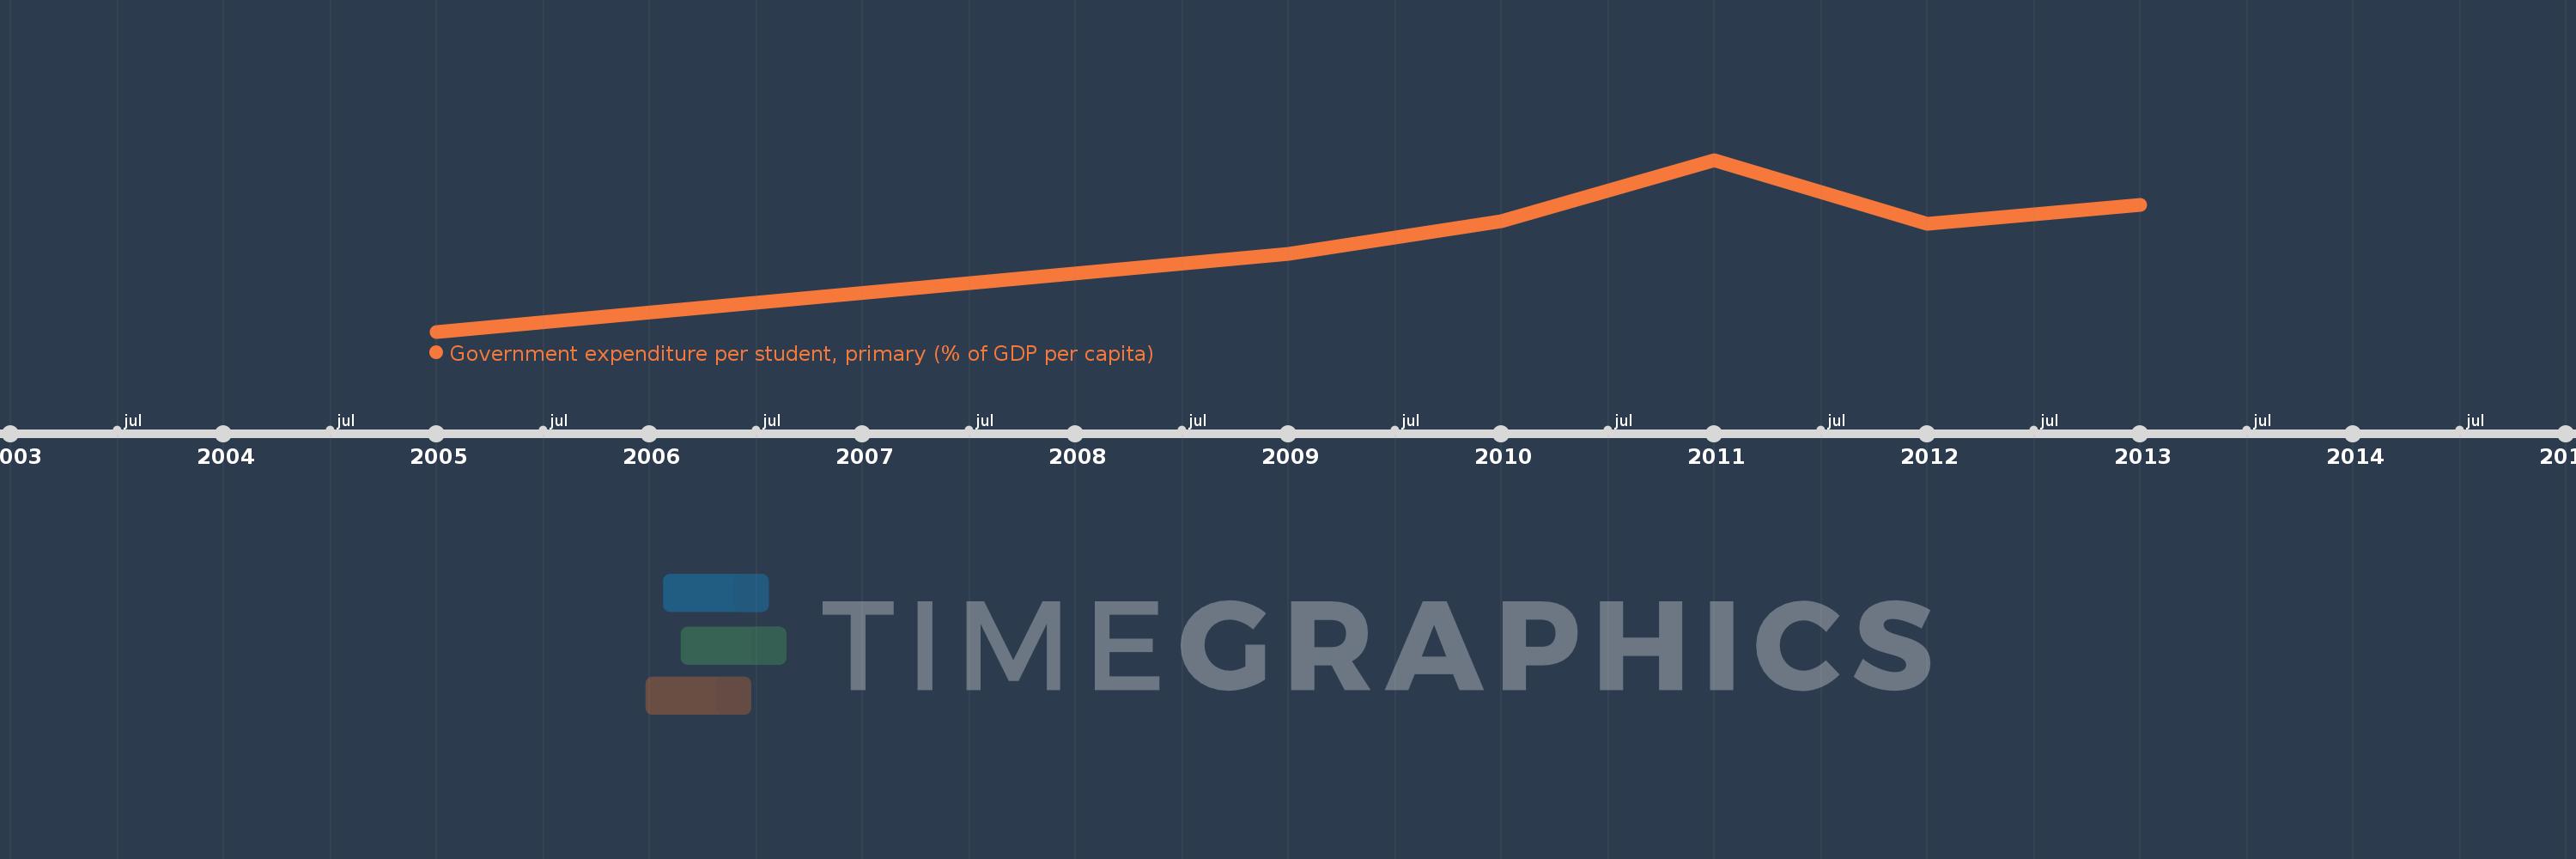
Government expenditure per student, primary (% of GDP per capita)
2013,2012,2011,2010,2009,2005
This statistics in other country:
Timeline:
This timeline shows a graph from 2005 to 2013 of Late-demographic dividend. No data until 2004. Number of actual observations by date: 6.
Source name:
World Development Indicators
Source organization:
United Nations Educational, Scientific, and Cultural Organization (UNESCO) Institute for Statistics.
Categories, topics:
Education
Last updated:
apr 23, 2017
Indicators value changes by year
Minimum:
13.689
jan 1, 2005
Maximum:
20.799
jan 1, 2011
At the date of observation
Value
Absolute change
Change from previous value
jan 1, 2005
13.689
+13.689
0.0%
jan 1, 2009
16.904
+3.215
23.49%
jan 1, 2010
18.248
+1.345
7.95%
jan 1, 2011
20.799
+2.551
13.98%
jan 1, 2012
18.154
-2.645
-12.72%
jan 1, 2013
18.945
+0.791
4.36%
Ranking of countries by current statistics by years


Comments: