29
/
en
AIzaSyAYiBZKx7MnpbEhh9jyipgxe19OcubqV5w
April 1, 2024
180598
Liechtenstein
LIE
true
2
1
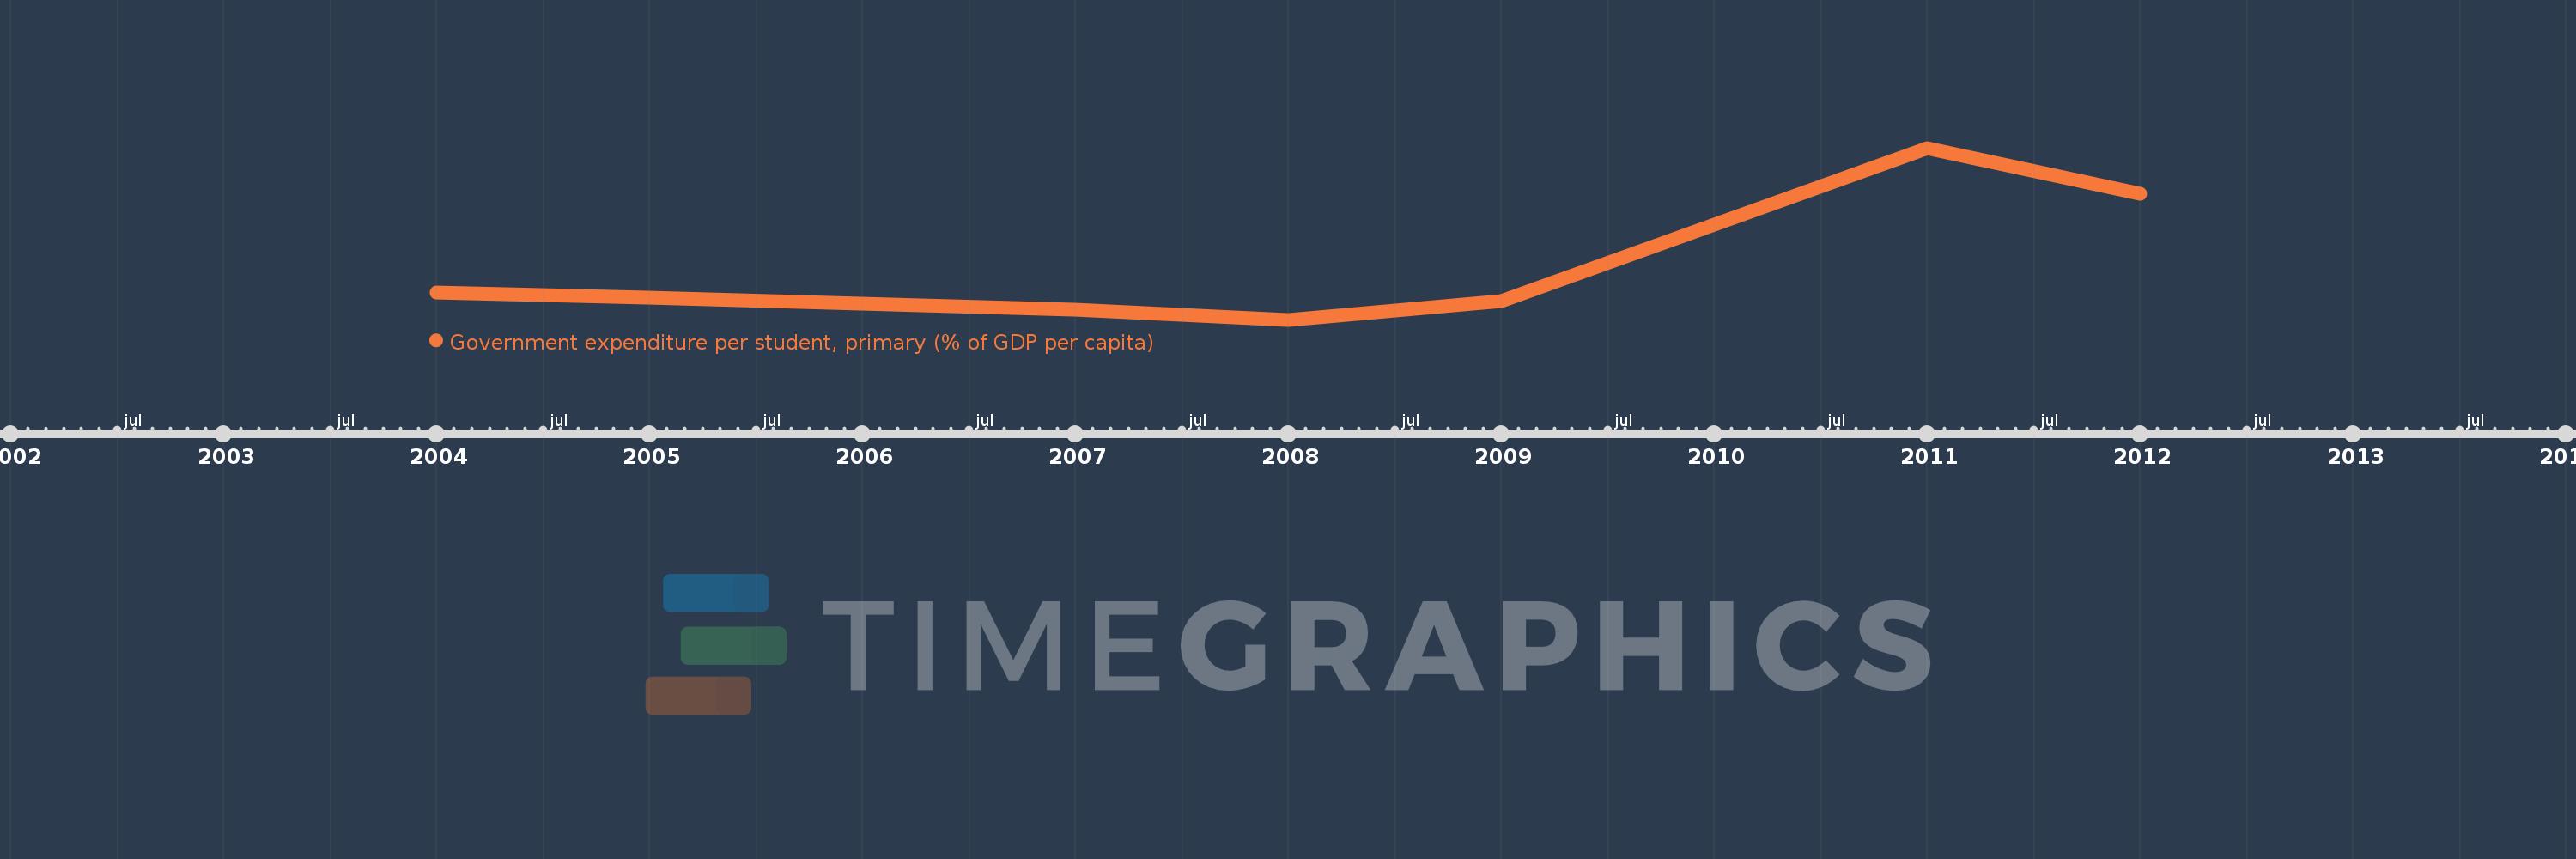
Government expenditure per student, primary (% of GDP per capita)
2012,2011,2009,2008,2007,2005,2004
This statistics in other country:
Timeline:
This timeline shows a graph from 2004 to 2012 of Liechtenstein. No data until 2003. Number of actual observations by date: 7.
Source name:
World Development Indicators
Source organization:
United Nations Educational, Scientific, and Cultural Organization (UNESCO) Institute for Statistics.
Categories, topics:
Education
Last updated:
apr 23, 2017
Indicators value changes by year
At the date of observation
Value
Absolute change
Change from previous value
jan 1, 2004
11.131
+11.131
0.0%
jan 1, 2005
10.766
-0.365
-3.28%
jan 1, 2007
9.967
-0.799
-7.42%
jan 1, 2008
9.273
-0.695
-6.97%
jan 1, 2009
10.533
+1.26
13.59%
jan 1, 2011
21.08
+10.547
100.13%
jan 1, 2012
17.908
-3.171
-15.04%
Ranking of countries by current statistics by years


Comments: