29
/
en
AIzaSyAYiBZKx7MnpbEhh9jyipgxe19OcubqV5w
April 1, 2024
112285
Costa Rica
CRI
true
2
1
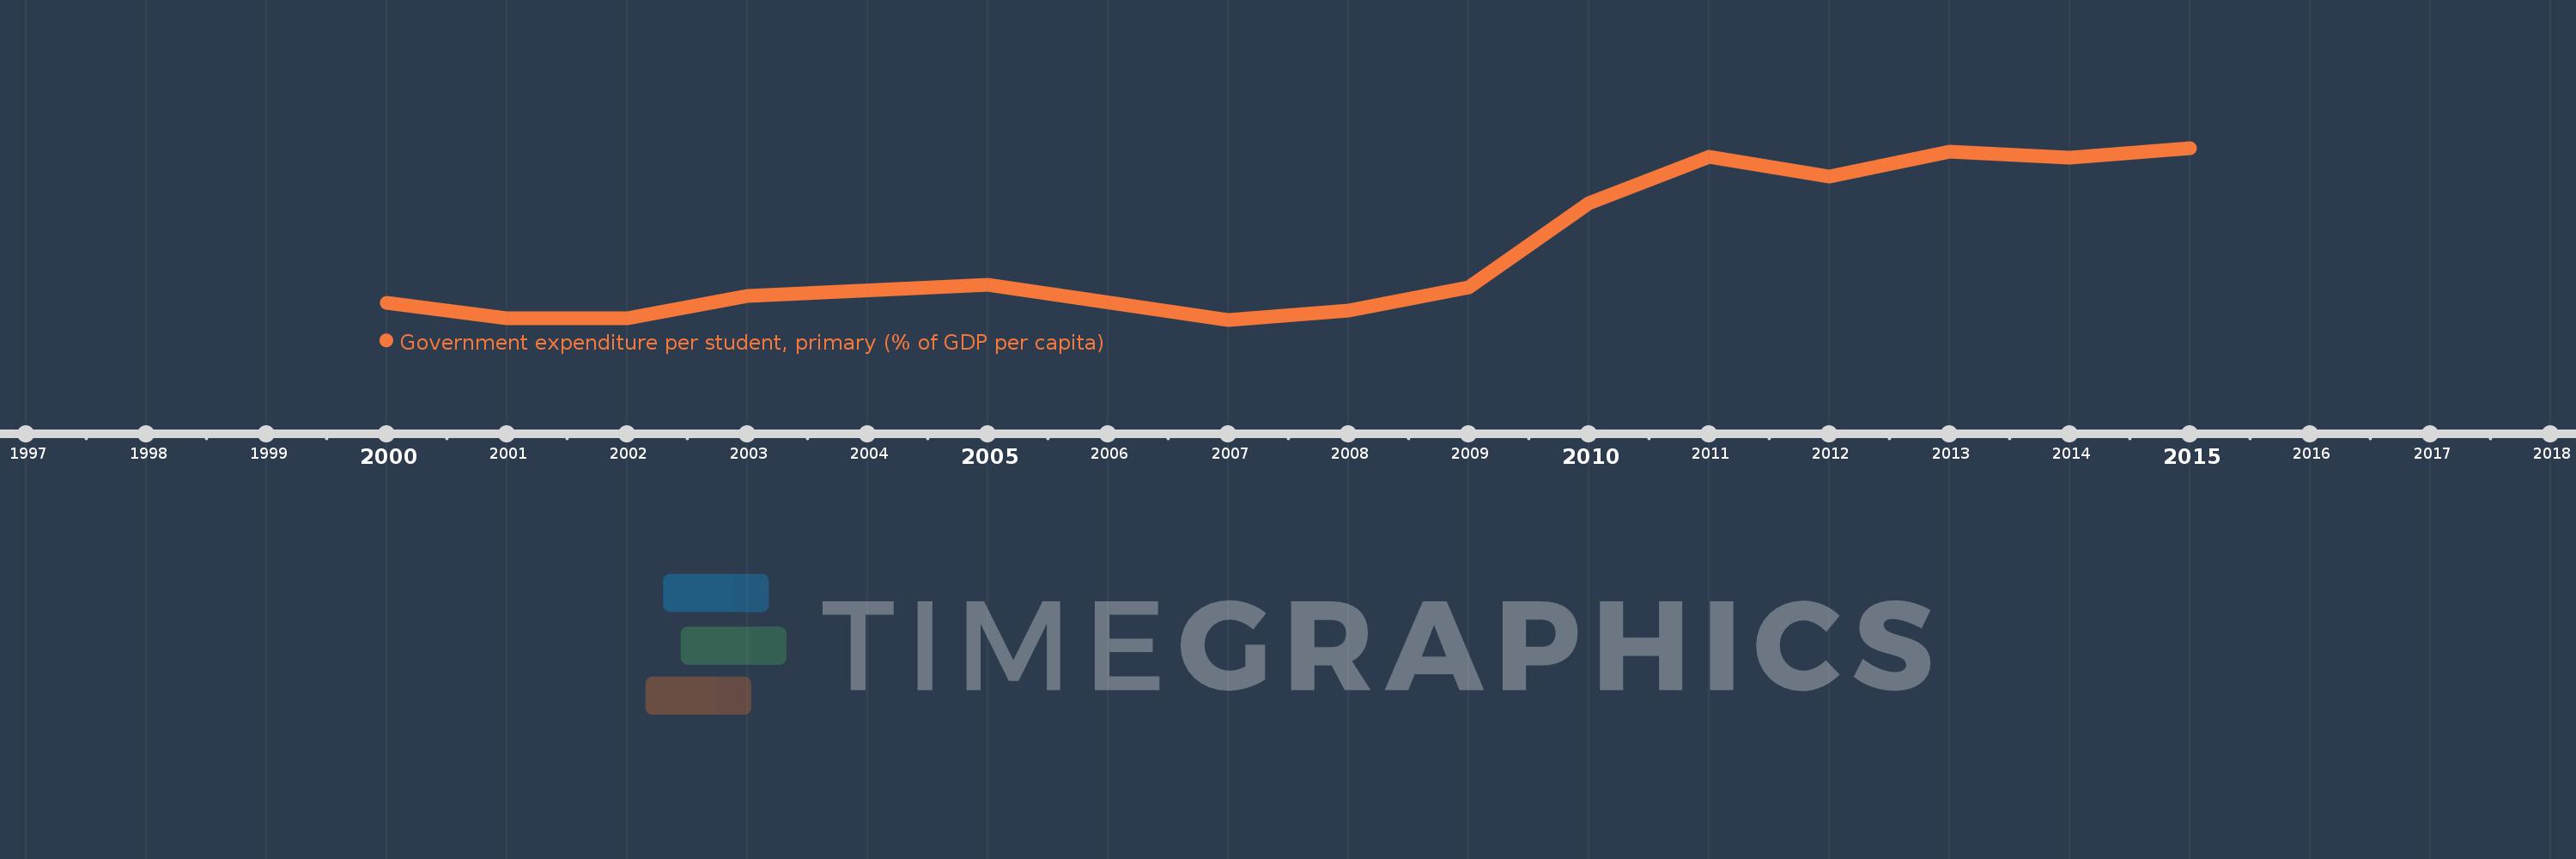
Government expenditure per student, primary (% of GDP per capita)
2015,2014,2013,2012,2011,2010,2009,2008,2007,2005,2003,2002,2001,2000
This statistics in other country:
Timeline:
This timeline shows a graph from 2000 to 2015 of Costa Rica. No data until 1999. Number of actual observations by date: 14.
Source name:
World Development Indicators
Source organization:
United Nations Educational, Scientific, and Cultural Organization (UNESCO) Institute for Statistics.
Categories, topics:
Education
Last updated:
apr 23, 2017
Indicators value changes by year
Minimum:
14.465
jan 1, 2007
At the date of observation
Value
Absolute change
Change from previous value
jan 1, 2000
15.545
+15.545
0.0%
jan 1, 2001
14.552
-0.993
-6.39%
jan 1, 2002
14.561
+0.009
0.06%
jan 1, 2003
16.013
+1.452
9.97%
jan 1, 2005
16.693
+0.68
4.24%
jan 1, 2007
14.465
-2.228
-13.35%
jan 1, 2008
15.028
+0.563
3.89%
jan 1, 2009
16.519
+1.491
9.92%
jan 1, 2010
21.899
+5.38
32.57%
jan 1, 2011
24.921
+3.022
13.8%
jan 1, 2012
23.614
-1.307
-5.24%
jan 1, 2013
25.246
+1.632
6.91%
jan 1, 2014
24.825
-0.421
-1.67%
jan 1, 2015
25.46
+0.635
2.56%
Ranking of countries by current statistics by years


Comments: