29
/
en
AIzaSyAYiBZKx7MnpbEhh9jyipgxe19OcubqV5w
April 1, 2024
154637
India
IND
true
2
1
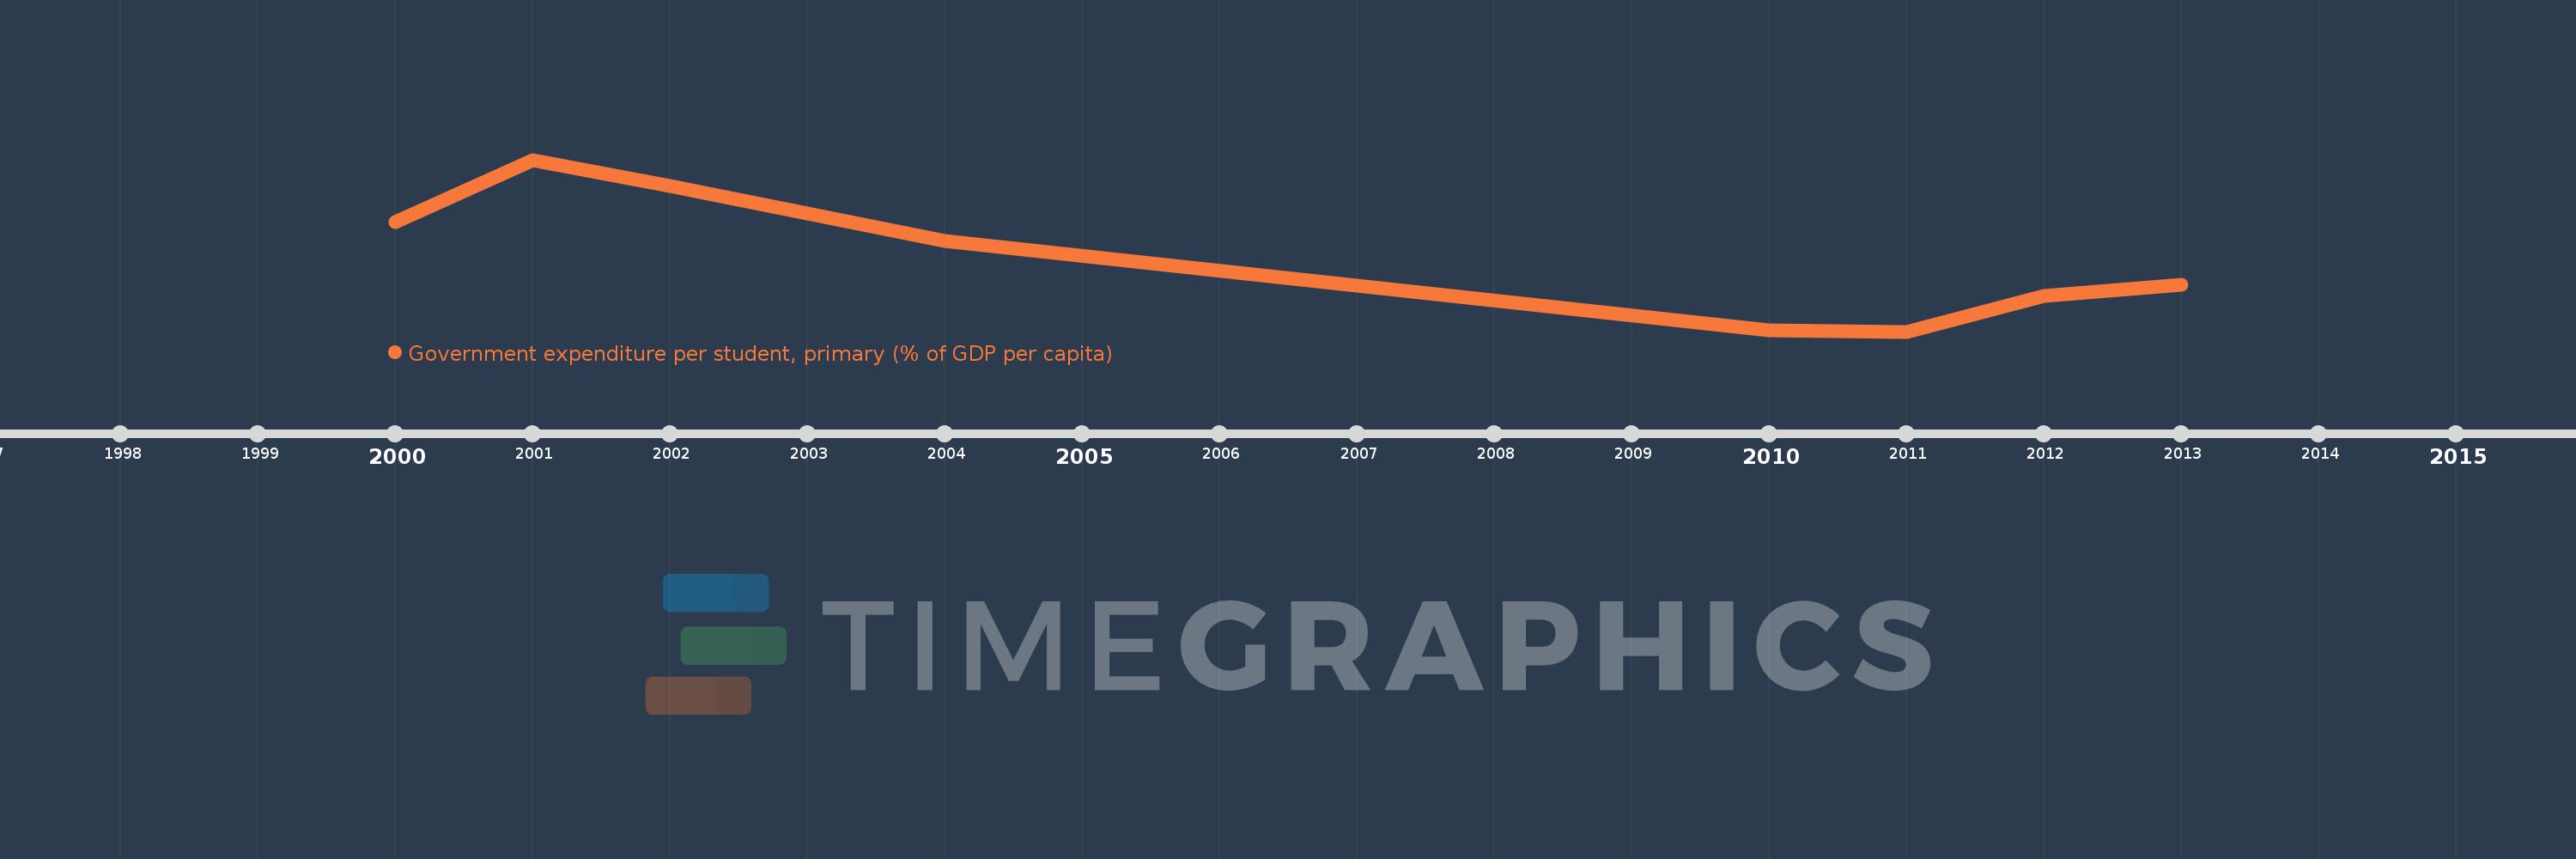
Government expenditure per student, primary (% of GDP per capita)
2013,2012,2011,2010,2004,2002,2001,2000
This statistics in other country:
Timeline:
This timeline shows a graph from 2000 to 2013 of India. No data until 1999. Number of actual observations by date: 8.
Source name:
World Development Indicators
Source organization:
United Nations Educational, Scientific, and Cultural Organization (UNESCO) Institute for Statistics.
Categories, topics:
Education
Last updated:
apr 23, 2017
Indicators value changes by year
Maximum:
14.542
jan 1, 2001
At the date of observation
Value
Absolute change
Change from previous value
jan 1, 2000
11.94
+11.94
0.0%
jan 1, 2001
14.542
+2.602
21.79%
jan 1, 2002
13.455
-1.087
-7.47%
jan 1, 2004
11.123
-2.332
-17.33%
jan 1, 2010
7.411
-3.712
-33.37%
jan 1, 2011
7.34
-0.071
-0.96%
jan 1, 2012
8.833
+1.493
20.34%
jan 1, 2013
9.285
+0.452
5.11%
Ranking of countries by current statistics by years


Comments: