29
/
en
AIzaSyAYiBZKx7MnpbEhh9jyipgxe19OcubqV5w
April 1, 2024
169945
Korea, Rep.
KOR
true
2
1
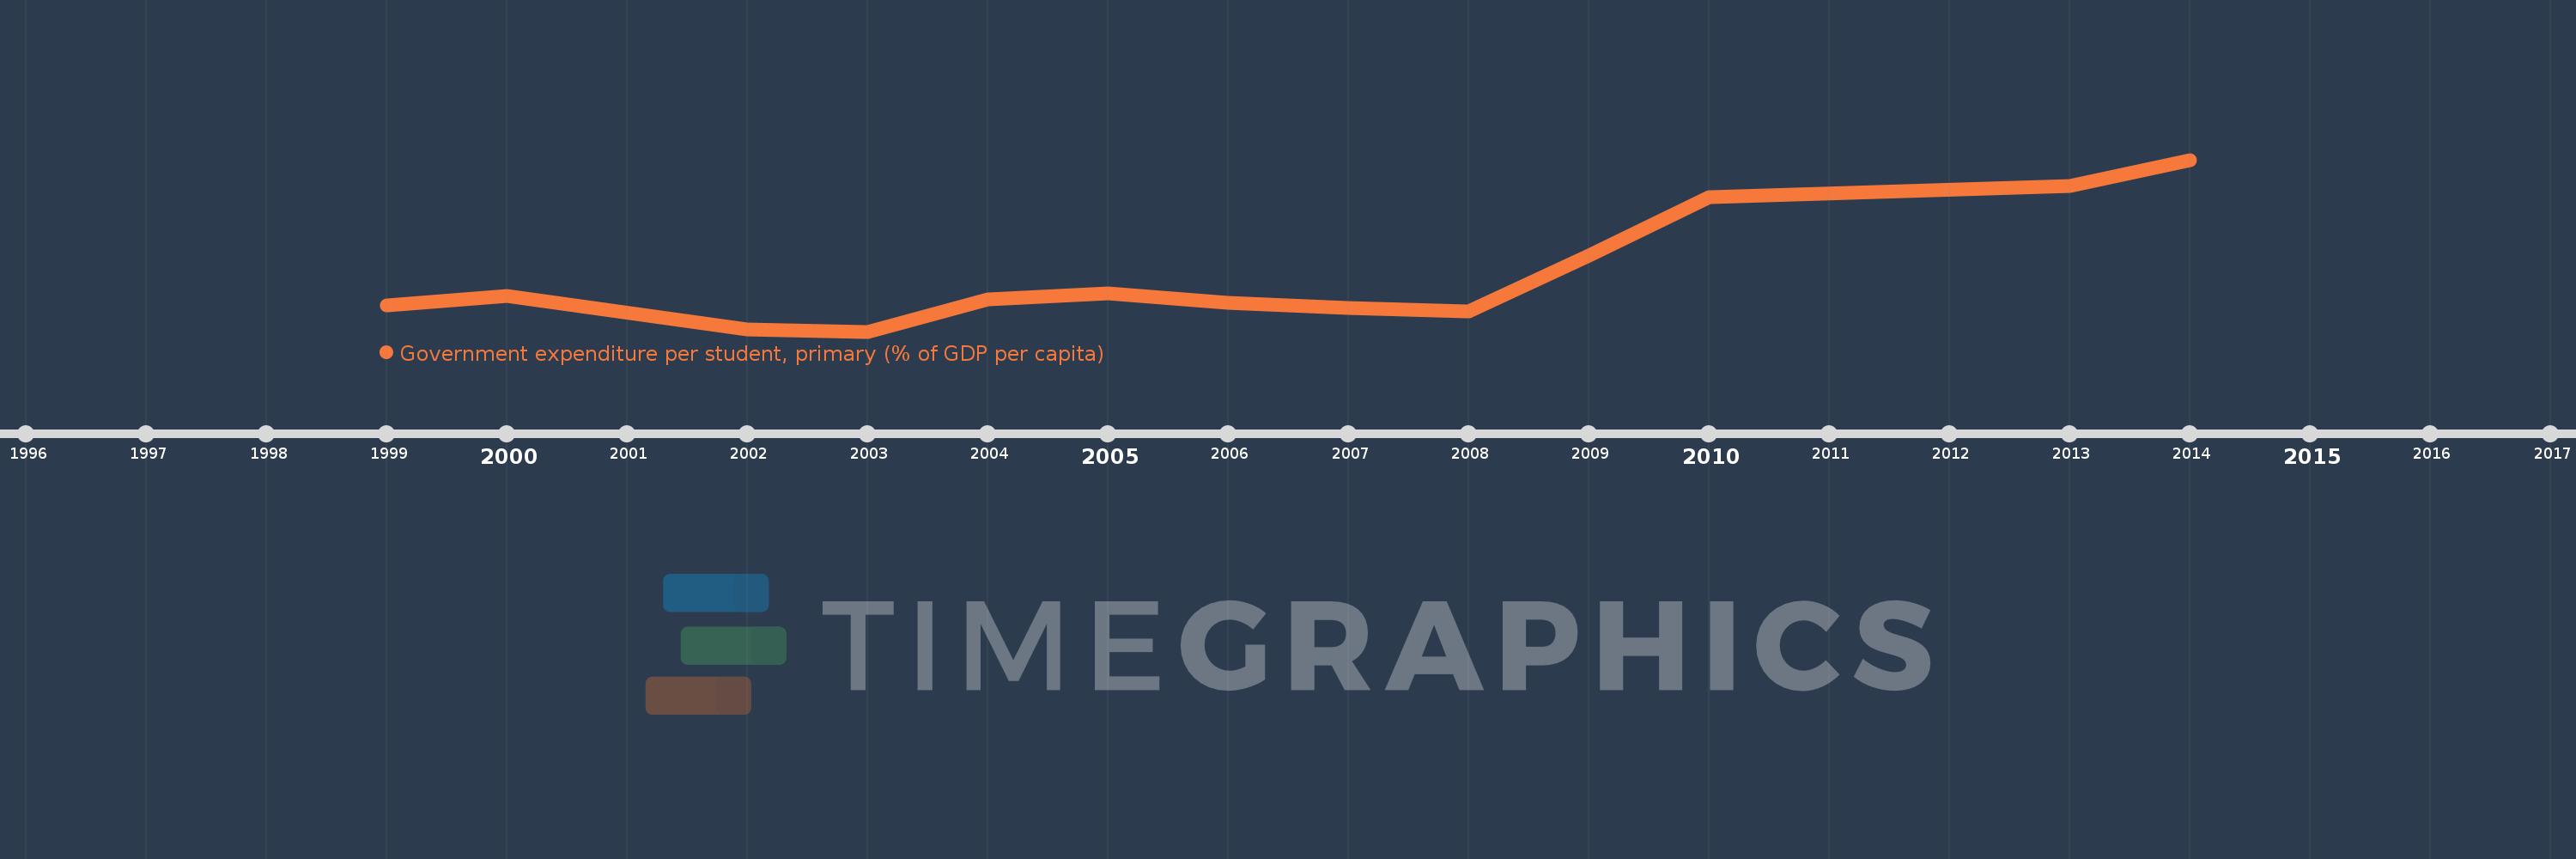
Government expenditure per student, primary (% of GDP per capita)
2014,2013,2010,2009,2008,2007,2006,2005,2004,2003,2002,2000,1999
This statistics in other country:
Timeline:
This timeline shows a graph from 1999 to 2014 of Korea, Rep.. No data until 1998. Number of actual observations by date: 13.
Source name:
World Development Indicators
Source organization:
United Nations Educational, Scientific, and Cultural Organization (UNESCO) Institute for Statistics.
Categories, topics:
Education
Last updated:
apr 23, 2017
Indicators value changes by year
Minimum:
14.785
jan 1, 2003
Maximum:
24.869
jan 1, 2014
At the date of observation
Value
Absolute change
Change from previous value
jan 1, 1999
16.343
+16.343
0.0%
jan 1, 2000
16.868
+0.525
3.21%
jan 1, 2002
14.89
-1.978
-11.73%
jan 1, 2003
14.785
-0.104
-0.7%
jan 1, 2004
16.651
+1.866
12.62%
jan 1, 2005
17.053
+0.402
2.41%
jan 1, 2006
16.489
-0.564
-3.31%
jan 1, 2007
16.187
-0.303
-1.84%
jan 1, 2008
15.948
-0.239
-1.48%
jan 1, 2009
19.222
+3.274
20.53%
jan 1, 2010
22.671
+3.449
17.94%
jan 1, 2013
23.333
+0.662
2.92%
jan 1, 2014
24.869
+1.536
6.58%
Ranking of countries by current statistics by years


Comments: