29
/
en
AIzaSyAYiBZKx7MnpbEhh9jyipgxe19OcubqV5w
April 1, 2024
33459
European Union
EUU
false
2
1
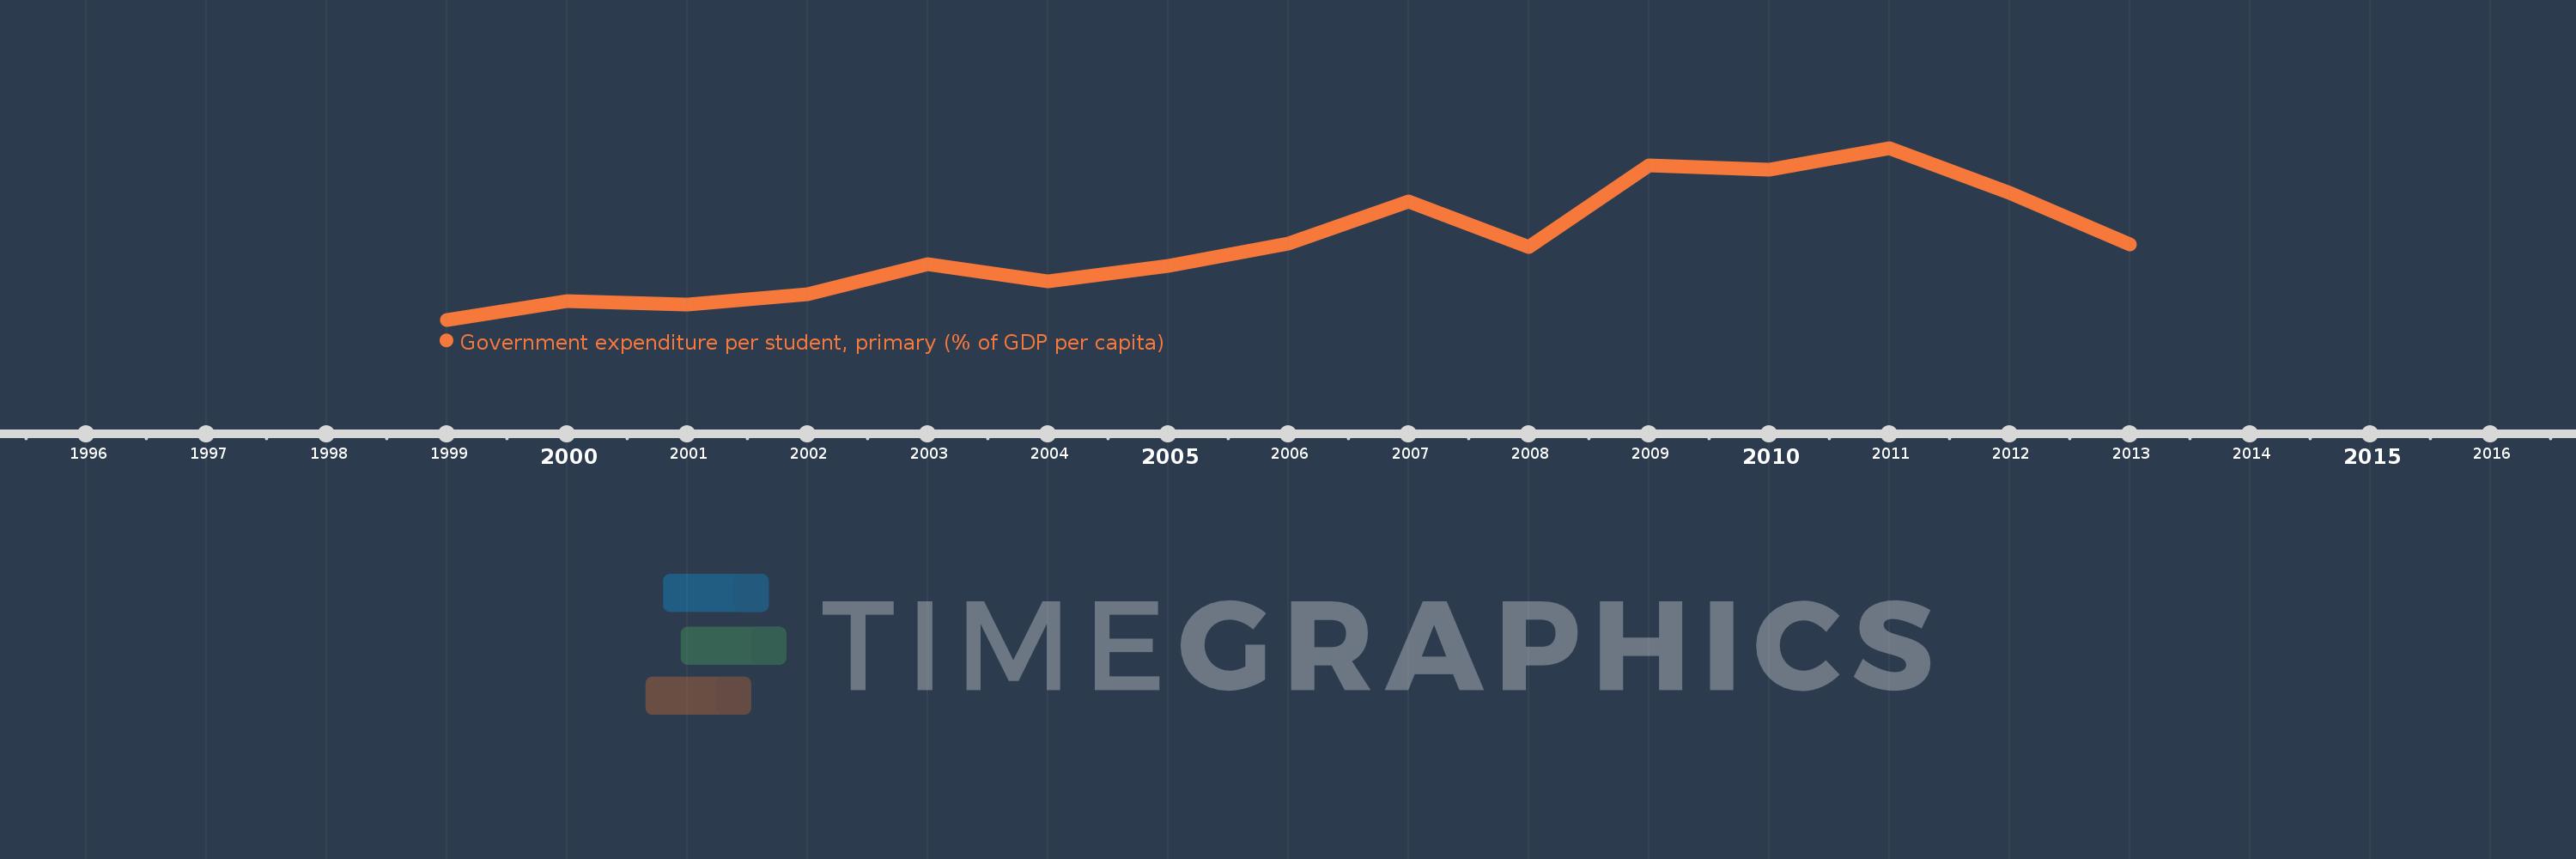
Government expenditure per student, primary (% of GDP per capita)
2013,2012,2011,2010,2009,2008,2007,2006,2005,2004,2003,2002,2001,2000,1999
This statistics in other country:
Timeline:
This timeline shows a graph from 1999 to 2013 of European Union. No data until 1998. Number of actual observations by date: 15.
Source name:
World Development Indicators
Source organization:
United Nations Educational, Scientific, and Cultural Organization (UNESCO) Institute for Statistics.
Categories, topics:
Education
Last updated:
apr 23, 2017
Indicators value changes by year
Minimum:
16.984
jan 1, 1999
Maximum:
22.236
jan 1, 2011
At the date of observation
Value
Absolute change
Change from previous value
jan 1, 1999
16.984
+16.984
0.0%
jan 1, 2000
17.565
+0.581
3.42%
jan 1, 2001
17.448
-0.118
-0.67%
jan 1, 2002
17.755
+0.307
1.76%
jan 1, 2003
18.69
+0.935
5.27%
jan 1, 2004
18.169
-0.521
-2.79%
jan 1, 2005
18.62
+0.451
2.48%
jan 1, 2006
19.316
+0.695
3.73%
jan 1, 2007
20.598
+1.282
6.64%
jan 1, 2008
19.211
-1.388
-6.74%
jan 1, 2009
21.699
+2.488
12.95%
jan 1, 2010
21.563
-0.136
-0.63%
jan 1, 2011
22.236
+0.673
3.12%
jan 1, 2012
20.86
-1.376
-6.19%
jan 1, 2013
19.284
-1.576
-7.56%
Ranking of countries by current statistics by years


Comments: